Business Challenge
The previous post ended on a fleet of polite clients overwhelming a dependency, and the standard answer to that: put a queue in front of it. This post is about what the queue then tells you, which is less than most dashboards imply.
A backlog is growing. The consumers are Lambda functions on an SQS event source mapping. The age-of-oldest-message alarm has not fired. Somebody adds capacity, the queue drains, and two hours later the database behind the consumers is the incident instead.
Three assumptions failed, and the second one is the kind of thing you only find by reading the metric definition rather than the metric.
ApproximateNumberOfMessagesVisible is defined as the messages
“currently available for retrieval and processing”, and AWS is careful to
call it what it is: it “reflects the current processing backlog in the queue”,
where a consistently high value “may indicate under-provisioned consumers or stuck
processing logic.”
May indicate, and two different causes. Depth is an integral — the accumulated difference between arrival and completion since the imbalance started. By the time it is visibly large, the imbalance is old. It is a good alarm and a poor early warning, and it cannot tell you which of the two causes you have.
FixAlarm on it, but diagnose with something else. Depth says “behind”, never “why”.
This is the one worth the whole post. ApproximateAgeOfOldestMessage
is the metric everyone reaches for, because latency beats volume as a health signal. Then read
what it does under failure:
“For standard queues, if a message is received three or more times and not deleted, SQS moves it to the back of the queue. The metric then reflects the age of the next message that hasn't exceeded the receive threshold. This reordering occurs even when a redrive policy is in place.”
And explicitly: “Poison-pill messages (those repeatedly received but never deleted) are excluded from this metric until successfully processed.”
So a message your consumer keeps failing on is removed from the very metric meant to reveal that it is stuck. The alarm gets healthier as the failure sets in.
FixTreat the age metric as a measure of the healthy path. Detect stuck work at the DLQ and the receive count.
A queue does not absorb load. It defers it. Draining faster means delivering the deferred load to whatever the consumers depend on — a database, a third-party API, a downstream service with its own limits.
On a default SQS event source mapping this happens without anybody choosing it. Lambda “starts processing five batches at a time with five concurrent invocations”, then “increases the number of processes that are reading batches by up to 300 more concurrent invokes per minute”, up to a ceiling of 1,250. The backlog itself is the trigger. Nobody scaled anything.
FixDecide the drain rate deliberately, sized to the slowest thing downstream, not to the queue.
Architecture
The useful frame is that a queue has two independent rates — arrival and drain — and backpressure is the decision about which one you are willing to constrain.
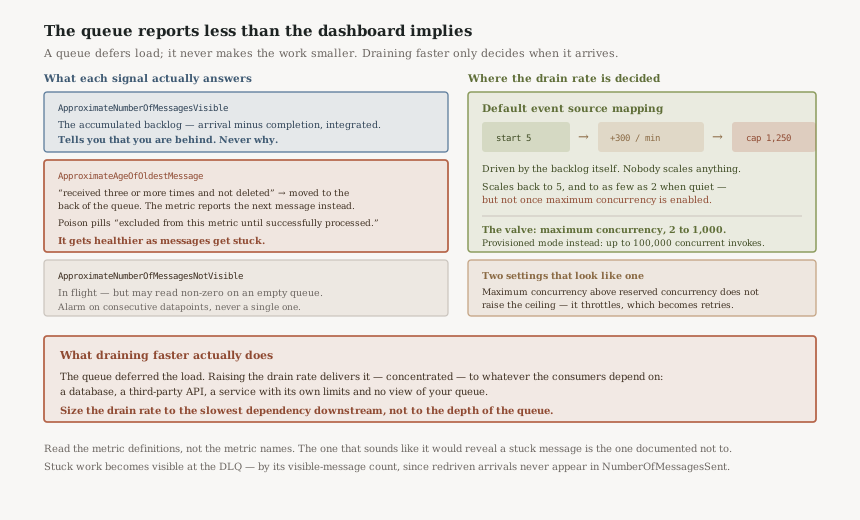
The default drain rate is aggressive, and it is automatic
The scaling curve is worth knowing precisely, because it is the thing that turns a queue into an amplifier. Five concurrent invocations to start. Up to 300 more per minute while messages remain. A hard ceiling of 1,250 simultaneous invokes for the event source mapping, and if the account concurrency quota is at its default of 1,000, that quota binds first.
In the other direction it is thriftier than most people expect: low traffic scales back to five, and “can optimize to as few as 2 concurrent invokes to reduce the Amazon SQS calls and corresponding costs.” With one caveat that matters if you reach for the obvious valve: “this optimization is not available when you enable the maximum concurrency setting.” Capping the top costs you the floor.
Maximum concurrency is the valve, and it has a trap
The event source's maximum concurrency — a value “between 2 and 1,000”, with “no charge for configuring” it — is the correct place to express “this queue may consume at most this much of my system.” It is per event source, so several queues on one function can each have their own.
AWS is direct about the failure: “Maximum concurrency and reserved concurrency are two independent settings. Don't set maximum concurrency higher than the function's reserved concurrency… Otherwise, Lambda might throttle your messages.” Setting a generous maximum concurrency against a smaller reserved concurrency does not raise the ceiling — it produces throttling, which the event source treats as failure, which drives retries and receive counts up. The valve, misconfigured, manufactures the poison pills that then vanish from your age metric.
FIFO queues have a second ceiling that no setting overrides: concurrency is capped “either by the number of message group IDs… or the maximum concurrency setting — whichever is lower.” AWS's own example is six message groups against a maximum concurrency of ten, yielding six. On a FIFO queue, your parallelism is a property of how producers assign group IDs, decided upstream and often by a different team.
Why This Architecture Holds Up
Every signal here is explicitly approximate
AWS opens the metric reference with the caveat: “For some metrics, the result is approximate because of the distributed architecture of Amazon SQS.” That is not boilerplate, and one case has a concrete operational consequence.
ApproximateNumberOfMessagesNotVisible “might report a non-zero
value, including when the queue is otherwise empty or has had no ReceiveMessage
calls” — and AWS's guidance is to “evaluate multiple consecutive data points
rather than a single non-zero value.” Any alarm here wants several datapoints to alarm, not
one. A single-datapoint alarm on an SQS metric is a pager that will eventually fire at 3am for nothing.
Since the age metric hides poison pills and depth cannot distinguish causes, the DLQ is the signal that does not lie — with one correction to make first. AWS documents that DLQ arrivals via redrive are invisible to the obvious counter: “Messages automatically moved to a DLQ due to processing failures are not captured by” NumberOfMessagesSent. The recommended metric for a DLQ is ApproximateNumberOfMessagesVisible on the DLQ itself. And note the age resets on arrival: a DLQ's age metric “reflects the time the message was moved—not when it was originally sent.” The DLQ tells you something is broken; it cannot tell you how long it has been broken.
FIFO fails differently, and more honestly
The reordering that hides poison pills is a standard-queue behaviour. FIFO cannot do it: “FIFO queues don't reorder messages to preserve order. A failed message blocks its message group until it's deleted or expires.”
That is worse for throughput and better for observability. A stuck message on a FIFO queue halts its group and the age metric climbs, which is exactly the alarm you wanted. On a standard queue the same failure is smoothed away. When choosing between them, this belongs in the comparison alongside ordering and deduplication — a standard queue is more forgiving of a bad message and quieter about it.
Provisioned mode changes the shape, not the principle
For workloads that cannot wait through the default ramp, provisioned mode “scales 3x
faster (up to 1,000 concurrent invokes per minute) and supports 80x higher concurrency (up to 100,000
concurrent invokes).” Pollers are configured as a range —
MinimumPollers between 2 and 200,
MaximumPollers between 2 and 10,000 — and each
poller handles “up to 1 MB/s of throughput, up to 10 concurrent invokes, or up to 10 Amazon
SQS polling API calls per second.”
It is a bigger, faster tap. The reasoning does not change: 100,000 concurrent invokes is a number your downstream dependency has to survive. And the two controls are mutually exclusive — provisioned mode cannot be combined with maximum concurrency, so you cap by poller count instead.
Key Architecture Decisions
| Decision | Choice | Reasoning |
|---|---|---|
| Primary backlog alarm | Depth, multi-datapoint | It is the honest aggregate. SQS metrics are approximate, so alarm on consecutive datapoints, never one. |
| Latency signal | Age, understood as healthy-path only | Standard queues move messages received 3+ times to the back, and exclude poison pills from the metric. |
| Stuck-work detection | DLQ depth, not the age metric | Redriven messages never appear in NumberOfMessagesSent. DLQ visible-count is AWS's recommendation. |
| Drain rate | Capped deliberately | The default ramps to 1,250 on backlog alone. Size it to the slowest dependency, not the queue. |
| Maximum concurrency | Set below reserved concurrency | They are independent. Maximum above reserved produces throttling, which becomes retries and receive counts. |
| Cost of capping | Accept the lost floor | Enabling maximum concurrency disables the scale-down to 2 concurrent invokes. |
| FIFO parallelism | Design the message group IDs | Concurrency is capped by group count or the setting, whichever is lower. Producers decide your ceiling. |
| Provisioned mode | Only with a downstream that can take it | Up to 100,000 concurrent invokes. Cap by poller count, since maximum concurrency cannot be used with it. |
The batching detail that distorts a low-traffic latency SLO
Lambda “polls up to 10 messages in your queue at once” by default, and a batch window can buffer for up to five minutes. On a quiet queue there is a floor worth knowing: “If you're using a batch window and your SQS queue contains very low traffic, Lambda might wait for up to 20 seconds before invoking your function. This is true even if you set a batch window lower than 20 seconds.”
A five-second batch window does not promise five-second latency on a quiet queue. If a low-volume path has a latency commitment, either drop the batch window or set the SLO above twenty seconds, because the documented behaviour will not honour anything tighter.
Closing Thought
A queue is usually introduced as a shock absorber, and it genuinely is one — for the producer. It lets a burst be accepted without being served. What it never does is make the work smaller, and every message in it is a promise that something downstream still has to keep.
That is why the instinct to drain faster is so often wrong. Draining is not resolving; it is choosing when the deferred load arrives and how concentrated it is when it does. The default event source mapping makes that choice for you, on the basis of backlog alone, up to 1,250 concurrent invocations — which is a decision about your database made by a queue that cannot see it.
And read the metric definitions rather than the metric names. ApproximateAgeOfOldestMessage
sounds like the one number that would tell you something is stuck. AWS documents that it is specifically
the number that will not.
Application patterns — multi-tenancy: pool, silo and bridge, what a noisy neighbour actually costs in a shared queue or table, and why the isolation decision is usually made implicitly by the first partition key somebody chose.
Official AWS Reference
- Available CloudWatch metrics for Amazon SQS — what the age metric excludes, and why DLQ counters disagree
- Configuring scaling behavior for SQS event source mappings — five to 1,250, and the maximum concurrency valve
- Using Lambda with Amazon SQS — batching, the 20-second low-traffic floor, and provisioned mode
Comments