Business Challenge
A SaaS company runs 80 AWS accounts — one per product environment, plus shared services. Their monthly AWS bill is $600,000. Finance sends a PDF on the 5th of each month with total spend and a top-10 service breakdown. When engineering asks "why did compute cost jump $40,000 in July?", the investigation takes a week: pull Cost Explorer for each account, export CSVs, merge them in Excel, cross-reference with deployment logs.
By the time the answer arrives, the cause is already two sprints old. The team that caused the spike has moved on to other work. The learning never lands. The pattern repeats.
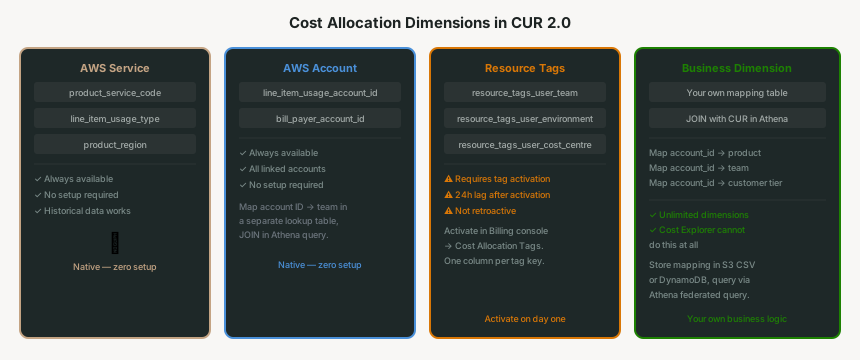
The second problem is dimensionality. AWS Cost Explorer shows you spend by service, by account, by region. It does not show you spend by product feature, by customer tier, by team, or by any business dimension you actually care about. Unless you model that through resource tagging — and query the raw data — those dimensions are invisible.
AWS Cost Explorer is excellent for a quick look at last month's bill. It is not designed for custom business dimensions, multi-account aggregation beyond its own interface, historical depth beyond 14 months, or JOIN-based analysis across your own metadata. For those use cases, you need the raw data.
Architecture
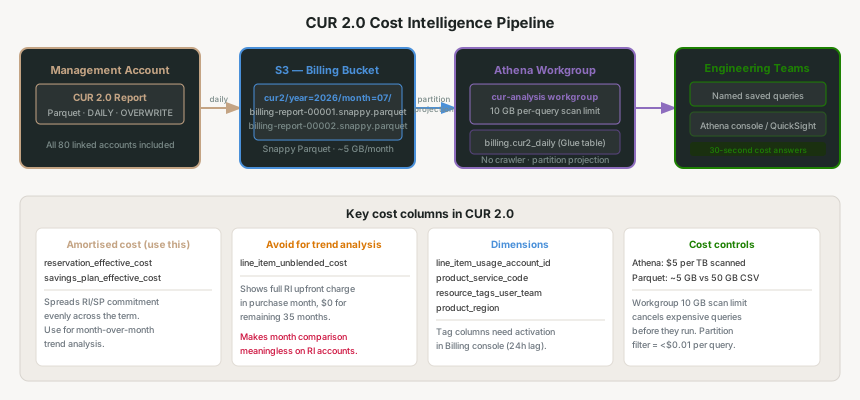
The platform has four components: a daily CUR 2.0 export from the management (payer) account into S3, a Glue table with partition projection to make the data queryable, Athena workgroups for cost-controlled access, and a set of saved named queries that answer the common engineering questions without requiring SQL expertise.
CUR 2.0 vs legacy CUR
CUR 2.0 (Cost and Usage Report, version 2) is the current format. If you enabled CUR before 2024, you are likely using legacy CUR — same concept, different column names and format defaults. CUR 2.0 defaults to Parquet export and uses cleaner column names (no camelCase prefixes). The migration is a configuration change in the Billing and Cost Management console, not a schema rewrite.
Key columns in CUR 2.0 that most teams do not use but should:
reservation_effective_cost
The amortised cost of Reserved Instance usage. Spreads the upfront RI payment evenly across the reservation term. Use this, not line_item_unblended_cost, when you want a per-month cost view that reflects RI economics correctly.
savings_plan_effective_cost
The amortised cost of Savings Plan coverage. Same principle as RI amortisation — spreads the commitment cost evenly. Sum reservation_effective_cost and savings_plan_effective_cost together for total amortised spend.
resource_tags_user_*
One column per activated cost allocation tag. A tag team activated in the billing console appears as resource_tags_user_team. This is how you build the team-level or feature-level cost breakdowns that Cost Explorer cannot show you.
line_item_usage_account_id
The linked account where the charge occurred. In a multi-account organisation, this is how you filter to a specific account without running separate Cost Explorer sessions per account. Combine with product_service_code for per-account, per-service cost.
S3 structure and partitioning
CUR 2.0 exports to S3 with a configurable prefix. The report writes daily, overwriting the current month's data with the cumulative month-to-date file. At month rollover, the prior month's file is finalised. The S3 path structure is:
s3://billing-exports-mgmt/cur2/
  year=2026/
    month=07/
      billing-report-00001.snappy.parquet
      billing-report-00002.snappy.parquet
  year=2026/
    month=06/
      billing-report-00001.snappy.parquet
Athena partition projection reads this structure without a Glue crawler — you declare the partition scheme in the table DDL and Athena synthesises the partitions on-demand. This eliminates the daily crawler invocation cost and the 15-minute crawler lag between a new partition landing in S3 and becoming queryable.
Why This Architecture Holds Up
Parquet columnar scanning keeps Athena cost low
Athena charges $5 per terabyte of data scanned. A CUR 2.0 file in CSV for a large multi-account organisation can exceed 50GB per month — at full row scan, that is $0.25 per query. The same data in Parquet with Snappy compression is typically 4–8GB. A query that touches 10 of CUR's 200+ columns reads only those columns, so if the columns are of broadly comparable width it scans on the order of 5% of the file — well under $0.01 per query. Column widths vary, so treat that as an order of magnitude rather than a rate card. Parquet is not optional; it is the economic foundation of the entire platform.
Historical depth beyond Cost Explorer
Cost Explorer displays up to 13 months of historical data plus the current month, and forecasts 18 months ahead. CUR exports in S3 are retained as long as your S3 lifecycle policy keeps them — typically 3–5 years for billing data under most compliance frameworks. Year-over-year spend analysis, multi-year trend detection, and historical audit queries all need more than that. CUR data in S3 provides that without additional tooling.
Custom business dimensions via JOIN
AWS cost allocation tags give you team-level or product-level cost if your engineers tag their resources consistently. But you can go further: maintain a separate DynamoDB table or S3 CSV that maps line_item_usage_account_id to business unit, product line, or customer tier. JOIN that mapping table in Athena with the CUR data. Cost Explorer has no equivalent — it only understands AWS-native dimensions.
Key Architecture Decisions
The most common CUR mistake is querying line_item_unblended_cost for cost analysis on accounts with Reserved Instances or Savings Plans. Unblended cost records the full upfront payment in the month of purchase and then nothing for subsequent months — a $36,000 3-year RI purchased in January shows as $36,000 in January and $0 for the next 35 months. That is technically correct billing, but it makes month-over-month cost comparison meaningless.
For cost analysis, use the amortised cost expression: SUM(reservation_effective_cost + savings_plan_effective_cost + line_item_unblended_cost) with a filter that excludes line_item_line_item_type IN ('DiscountedUsage', 'SavingsPlanCoveredUsage') to avoid double-counting. The AWS documentation calls this the "net amortised cost" view. Most FinOps teams save this as an Athena named query called monthly_amortised_cost_by_service.
Resource tags applied to EC2 instances, RDS clusters, and S3 buckets do not automatically appear in CUR. Each tag key must be individually activated in the AWS Billing and Cost Management console under "Cost Allocation Tags." Activation takes up to 24 hours to take effect, and the tag only appears in CUR from the activation date forward — it is not retroactive. A team tag applied to every resource in your account today will not appear in last month's CUR data.
Activate cost allocation tags on day one of the CUR project, not after the queries are built. A common pattern is to activate the 10–15 tag keys you care about (team, environment, product, cost-centre) as part of the CUR setup, then enforce tagging compliance via AWS Config or a tag policy in AWS Organizations. The months of CUR data collected before tag activation will have those columns empty — plan your analysis accordingly.
Without a workgroup cost limit, a poorly written Athena query that scans an entire year of unpartitioned CUR data can cost $50–200 in a single query. In a multi-team environment where engineers have direct Athena access, this is a real risk. Athena workgroups let you set a per-query data limit — queries that would scan more than the limit are cancelled before execution begins.
Recommended configuration
Create a dedicated cur-analysis workgroup with a 10GB per-query data scan limit and a monthly workgroup limit of 1TB. With Parquet data and partition projection filtering to year and month, 10GB is sufficient for any reasonable single-month, multi-account query. Engineers who need to run larger historical analyses can use a separate cur-analysis-unrestricted workgroup with explicit approval — that workgroup's usage goes to cost tracking, not a blanket limit.
CUR can be configured in any AWS account, but it only sees the billing data for that account and any accounts it manages. If you configure CUR in a linked account, you get only that account's charges. To see all 80 accounts' charges in a single query, CUR must be configured in the management (payer) account of your AWS Organization. This is a one-time setup decision — you cannot move a CUR report between accounts without creating a new one and losing historical continuity.
Security note
The S3 bucket receiving CUR exports must be in the management account or in an account the management account has cross-account S3 write permission to. Most organisations use a dedicated billing account in their organization to hold the CUR exports and Athena workgroups, separate from the management account. Access to this bucket is restricted to the FinOps team and the Athena query role — raw billing data contains detailed resource usage that could reveal infrastructure details.
Reference: CUR 2.0 Setup with Terraform and Athena Partition Projection
The CUR report definition, S3 bucket, and Athena table with partition projection configured for daily Parquet exports:
# CUR report definition — must be in us-east-1
resource "aws_cur_report_definition" "main" {
  provider                   = aws.us_east_1
  report_name                = "cur2-daily"
  time_unit                  = "DAILY"
  format                     = "Parquet"
  compression                = "Parquet"
  additional_schema_elements = ["RESOURCES", "SPLIT_COST_ALLOCATION_DATA"]
  s3_bucket                  = aws_s3_bucket.cur.bucket
  s3_prefix                  = "cur2"
  s3_region                  = "us-east-1"
  report_versioning          = "OVERWRITE_REPORT"
  refresh_closed_reports     = true
}

# Glue database for Athena
resource "aws_glue_catalog_database" "billing" {
  name = "billing"
}

# Athena table with partition projection — no crawler needed
resource "aws_glue_catalog_table" "cur" {
  name          = "cur2_daily"
  database_name = aws_glue_catalog_database.billing.name

  table_type = "EXTERNAL_TABLE"

  parameters = {
    "projection.enabled"       = "true"
    "projection.year.type"     = "integer"
    "projection.year.range"    = "2024,2030"
    "projection.month.type"    = "integer"
    "projection.month.range"   = "1,12"
    "projection.month.digits"  = "2"
    "storage.location.template" = "s3://${aws_s3_bucket.cur.bucket}/cur2/year=${!{year}}/month=${!{month}}/"
    "classification"            = "parquet"
    "parquet.compression"       = "SNAPPY"
  }

  partition_keys {
    name = "year"
    type = "int"
  }
  partition_keys {
    name = "month"
    type = "int"
  }

  storage_descriptor {
    location      = "s3://${aws_s3_bucket.cur.bucket}/cur2/"
    input_format  = "org.apache.hadoop.hive.ql.io.parquet.MapredParquetInputFormat"
    output_format = "org.apache.hadoop.hive.ql.io.parquet.MapredParquetOutputFormat"

    ser_de_info {
      serialization_library = "org.apache.hadoop.hive.ql.io.parquet.serde.ParquetHiveSerDe"
    }

    # Key columns — CUR 2.0 has 200+ columns; define the ones you query
    columns { name = "line_item_usage_account_id"    type = "string" }
    columns { name = "line_item_product_code"         type = "string" }
    columns { name = "line_item_usage_type"           type = "string" }
    columns { name = "line_item_line_item_type"       type = "string" }
    columns { name = "line_item_unblended_cost"       type = "double" }
    columns { name = "reservation_effective_cost"     type = "double" }
    columns { name = "savings_plan_effective_cost"    type = "double" }
    columns { name = "product_service_code"           type = "string" }
    columns { name = "product_region"                 type = "string" }
    columns { name = "resource_tags_user_team"        type = "string" }
    columns { name = "resource_tags_user_environment" type = "string" }
    columns { name = "line_item_usage_start_date"     type = "timestamp" }
  }
}

# Athena workgroup with 10GB per-query scan limit
resource "aws_athena_workgroup" "cur_analysis" {
  name = "cur-analysis"
  configuration {
    result_configuration {
      output_location = "s3://${aws_s3_bucket.athena_results.bucket}/cur-analysis/"
    }
    bytes_scanned_cutoff_per_query     = 10737418240  # 10 GB
    publish_cloudwatch_metrics_enabled = true
  }
}
The named Athena query for monthly amortised cost by team — the query engineers run most often:
-- Save this as Athena named query: "monthly_cost_by_team"
SELECT
  resource_tags_user_team                                        AS team,
  product_service_code                                           AS service,
  ROUND(SUM(
    CASE
      WHEN line_item_line_item_type IN ('DiscountedUsage')
        THEN reservation_effective_cost
      WHEN line_item_line_item_type IN ('SavingsPlanCoveredUsage')
        THEN savings_plan_effective_cost
      ELSE line_item_unblended_cost
    END
  ), 2)                                                          AS amortised_cost_usd
FROM billing.cur2_daily
WHERE year  = 2026
  AND month = 7
  AND line_item_line_item_type NOT IN ('Tax', 'Credit', 'Refund')
GROUP BY 1, 2
ORDER BY amortised_cost_usd DESC
LIMIT 50;
Closing Thought
The reason most organisations cannot answer "where did our AWS bill go this month?" is not a tooling problem — AWS gives you the data. It is a pipeline problem: the data sits in a billing console export that nobody has wired up to a queryable interface.
CUR 2.0 + Athena changes that in a few hours of setup. Once the pipeline is live, cost questions that took a week to answer become a 30-second Athena query. Engineering teams start owning their cost decisions the same way they own their reliability decisions — with data, in real time, without waiting for a monthly finance report.
The three things that take longer than people expect: activating cost allocation tags (24h lag, non-retroactive), waiting for the first meaningful CUR data (reports run daily, but new report definitions take one billing cycle to build a usable history), and building team habits around querying cost before it becomes a problem rather than after. The pipeline is fast to build. The culture takes longer.
Resilience — Multi-region active-passive DR with Route 53 ARC: how to design a recovery architecture that works under real incident conditions, not just in a quarterly DR drill.
Official AWS Reference
- What is AWS Data Exports — the service that creates CUR 2.0
- Cost and Usage Reports User Guide — column reference and Athena integration
- Migrating from CUR to CUR 2.0 in Data Exports
- Amazon Athena pricing
- Analyzing your costs with AWS Cost Explorer — the 13-month retention window
- Partition projection with Amazon Athena
Comments