Cloud WAN now has its own flow logs, with the segment, Region and attachment metadata that makes a global network legible. The capability is real and the documentation is unusually candid about what the distinguishing part of it is worth.
“Metadata fields that do not come directly from the packet header are best effort approximations, and their values might be missing or inaccurate.”
Executive summary
“Flow log records include IP addresses, ports, protocol, traffic volume, and packet-loss counters, along with Cloud WAN metadata such as segment, Region, service insertion hops and attachment details.” Three destinations — “Amazon CloudWatch Logs, Amazon Simple Storage Service (Amazon S3), or Amazon Data Firehose” — and three scopes: “an entire core network, a single core network edge, or individual attachments.”
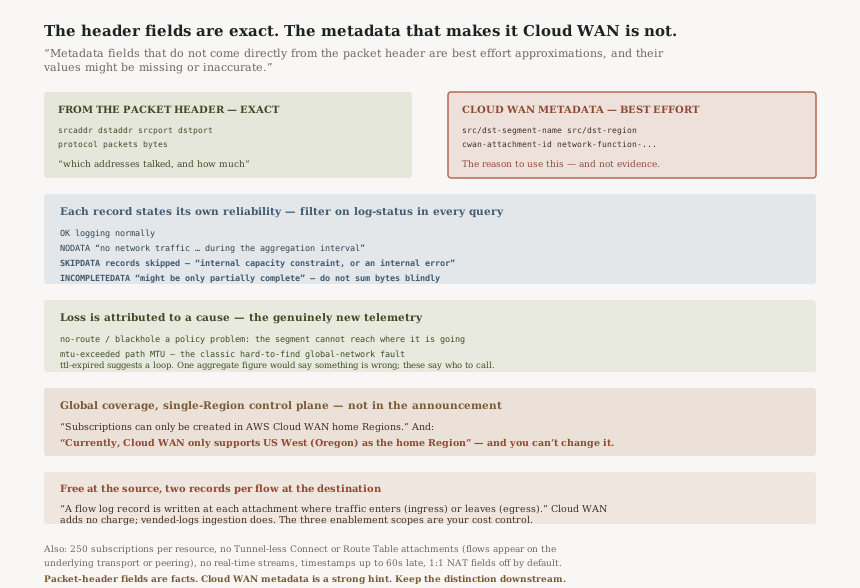
The packet-header fields come from the packet. The Cloud WAN metadata, which is the whole reason to prefer this over reading VPC flow logs, is explicitly approximate. That is not a reason to avoid the feature; it is a reason not to build an audit on the segment field.
And two scopes the announcement does not mention: you can only create subscriptions in a home Region, and there is currently one.
What changed
Cloud WAN gets the flow-log treatment that VPCs and transit gateways already had, at version 13 of the record format. “Cloud WAN Flow Logs capture end-to-end, attachment-to-attachment flows over your core network. A flow log record is written at each attachment where traffic enters (ingress) or leaves (egress) the core network.”
The new fields are the interesting part: src-segment-name and
dst-segment-name, src-region and dst-region,
cwan-attachment-id and cwan-pair-attachment-id,
network-function-group-attachment-ids for the service-insertion hops, plus four separate
packet-loss counters. None of that is derivable from a VPC flow log, which is why the feature exists.
Unchanged from other flow logs, and worth repeating: “Flow log data is collected outside of the path of your network traffic, and therefore does not affect network throughput or latency.” Turning this on is safe for the data plane.
Architecture
Which fields you can trust, and which are approximations
| Field group | Source | Reliability |
|---|---|---|
srcaddr, dstaddr, ports, protocol, packets, bytes |
The packet header | Taken from the packet itself |
src-segment-name, src-region, cwan-attachment-id, network-function-group-attachment-ids |
Cloud WAN metadata | “best effort approximations”, “might be missing or inaccurate” |
The second row is the feature's reason to exist, and AWS has labelled it honestly rather than quietly. There is a related caution for the same reason: “Segment IDs may be briefly stale during initial propagation”, and “A flow might not be correlated end-to-end because of an internal system error or an internal log propagation delay.”
So which segment did this traffic belong to is answerable with high confidence most of the time
and is not a field to build a compliance assertion on. Which addresses talked to each other and how
much comes from the packet itself. Both still sit under the log-status caveat below:
a record marked INCOMPLETEDATA may be partial whichever fields you are reading.
The record tells you when it is unreliable
log-status | Meaning |
|---|---|
OK | Data is logging normally to the chosen destinations |
NODATA | “There was no network traffic to or from the core network during the aggregation interval” |
SKIPDATA | “Some flow log records were skipped during the aggregation interval. This might be because of an internal capacity constraint, or an internal error” |
INCOMPLETEDATA | “The flow could not be fully captured during the aggregation interval, so the delivered flow record might be only partially complete” |
This is the right design and the part most pipelines will ignore. Any analysis that sums bytes
across records without filtering on log-status is adding partial records to complete ones.
NODATA is also the honest distinction #110 was about: no traffic is reported as a value,
not as an absence.
Loss is attributed to a cause, which is the genuinely new telemetry
Four counters rather than one: “packets-lost-no-route – The packets lost due
to no route being specified”,
“packets-lost-blackhole – The packets lost due to a black
hole”, “packets-lost-mtu-exceeded – The packets lost due to the
size exceeding the MTU”, and
“packets-lost-ttl-expired – The packets lost due to the expiration of
time-to-live.”
That is better than a loss percentage, because each counter implies a different fix. No route and blackhole are policy problems — a segment that cannot reach where it is trying to go. MTU exceeded is a path-MTU problem, which is the classic hard-to-diagnose global-network fault. TTL expired suggests a loop. A single aggregate loss number would have told you something is wrong; these tell you which team to call.
The scope the announcement does not carry
“Cloud WAN Flow Logs are available in all AWS Regions where AWS Cloud WAN is available” is true about where the logs cover. Creating the subscription is narrower:
“Subscriptions can only be created in AWS Cloud WAN home Regions.” And the home Region is singular: “Currently, Cloud WAN only supports US West (Oregon) as the home Region”, with “When it has been established, you can't change the home Region.”
So this is a global-coverage feature with a single-Region control plane, and the control plane Region is one you chose when you created the core network and cannot now change. For most Cloud WAN users that is already us-west-2 and the point is moot. For anyone operating under a data-residency constraint that excludes it, this is the paragraph that matters, and it is not in the announcement.
Three attachment types behave differently
“Tunnel-less Connect (TLC) attachments are not supported. Flows traversing a TLC attachment appear on the underlying transport (VPC) attachment”, and “Route Table attachments are not supported. Flows traversing a Route Table attachment appear on the underlying peering connection.”
Neither is a gap in coverage — the traffic is still logged — but it is logged somewhere other than where you would look for it. Enabling flow logs on a TLC attachment and seeing nothing is the documented behaviour, not a fault, and the fix is to subscribe on the transport attachment instead.
Business value
The value is attribution across a network that previously only reported in fragments. Before this, a flow crossing three Regions and a firewall produced VPC flow logs at each end and nothing in between, so reconstructing the path meant correlating by five-tuple and timestamp across accounts. Now a single record names both attachments, both segments, both Regions and the network function groups it traversed.
The loss attribution is the part with the clearest operational payoff. Global networks fail in ways that are hard to see from the edges — an MTU mismatch on one path, a blackhole route introduced by a policy change — and these counters name the cause in the record rather than requiring a packet capture.
Cost framing is honest: “Cloud WAN does not introduce any additional charges for this feature”, with the qualifier in the next section.
Security considerations
Creating a flow log requires core network ownership.
“To create a Cloud WAN flow log, you must be the owner of the core network and have
networkmanager:GetCoreNetwork permissions for the core network of the resource you are
subscribing on.” Attachment owners in a shared core network cannot enable flow logs on their
own attachments, so visibility is a central function here rather than a delegated one.
The logs carry cross-account identifiers. Records include
src-account-id and dst-account-id, plus VPC, subnet and ENI IDs on both sides.
In a core network shared across an organisation, a single destination bucket now contains the traffic
relationships of every participating account — which is the point, and also a concentration worth
treating as sensitive.
The 1:1 NAT fields are off by default.
“With the default format, the flow log records include all version 2 to version 13 fields
except the 1:1 NAT fields (src-nat-addr and dst-nat-addr).” If you
use NAT and need to trace a flow back to its pre-translation address, the default format will not let
you, and a custom format is required.
Do not treat the segment field as an isolation control. Segments are a real routing boundary; the field recording which segment a flow was in is a best-effort approximation. For proving isolation, the policy is the evidence, not the log.
Cost considerations
“Cloud WAN adds no charge for Flow Logs. Standard charges apply for each destination.” The docs are more specific about what those are: “Data ingestion and storage charges for vended logs apply when you publish Cloud WAN flow logs.”
The multiplier to model is structural rather than a rate: “A flow log record is written at each attachment where traffic enters (ingress) or leaves (egress) the core network.” One end-to-end flow therefore produces two records. Enable logs on an entire core network and you are paying Vended Logs ingestion on roughly double the flow count, at a core network that may carry every inter-Region byte your organisation sends.
Which makes the three scopes a cost control as much as a coverage one. “an entire core network, a single core network edge, or individual attachments” is a choice about bill size. Start at attachment scope on the paths you are investigating, and use a custom format to drop fields you will not query — the default carries every version 2 to 13 field, most of which no dashboard reads.
Operational considerations
This is not a real-time signal. “Flow logs do not capture real-time log streams for your core networks”, timestamps “might be up to 60 seconds after the packet was transmitted or received on the core network”, and after creating a subscription “it can take several minutes to begin collecting and publishing data”. Useful for investigation and capacity planning, not for a latency alarm.
Enabling the first subscription changes core network state. The docs note the core
network moves to UPDATING while resources are provisioned, and the subscription sits in
PROVISIONING before ACTIVE — and even then it can take several minutes
before log delivery starts. Worth knowing before enabling this mid-incident, which is exactly when
somebody will want to.
250 subscriptions per resource per account, and “To create additional subscriptions on a resource that has reached this limit, you must first delete existing subscriptions.” Generous, but it is a ceiling on fan-out to multiple destinations.
Filter on log-status in every query you write. Partial and skipped records
are delivered alongside complete ones, and nothing downstream separates them for you.
Tradeoffs
| Choice | What you gain | What it costs |
|---|---|---|
| Core network scope | Complete picture in one subscription | Vended Logs ingestion on roughly two records per flow, across everything |
| Attachment scope | Targeted, cheap, enough for an investigation | You have to know which attachment to look at first |
| Default record format | Nothing to configure, every field present | Pays to store fields nothing queries, and omits the 1:1 NAT fields anyway |
| Custom record format | Smaller records, and access to the NAT fields | Decide the field list up front — the default format cannot be customised, so changing shape means a new subscription |
| Trusting the segment field | Fast attribution across a global network | It is a best-effort approximation, not evidence |
Implementation guidance
Confirm your home Region before planning anything. Subscriptions can only be created there, it is currently only us-west-2, and it cannot be changed once established. This is the gate.
Start at attachment scope. Pick the two attachments either side of the path you are investigating. Core-network scope is the right answer for a permanent security-analytics feed and the wrong one for a first look.
Use a custom format and include log-status. Drop the fields you will not
query, and keep the one that tells you whether to trust the row.
If you use 1:1 NAT, add src-nat-addr and dst-nat-addr explicitly.
They are absent from the default format.
Check your attachment types. If the path crosses a Tunnel-less Connect or Route Table attachment, subscribe on the underlying transport VPC attachment or peering connection instead — subscribing on the attachment itself will show you nothing and that is expected.
Build the loss counters into a dashboard from day one. They are the field group with no prior equivalent, and the one most likely to answer a question you have been unable to answer.
Best practices
Treat packet-header fields as facts and Cloud WAN metadata as strong hints. The distinction is AWS's own and it should survive into whatever you build on top.
Separate the two use cases rather than running one subscription for both. A permanent core-network feed into S3 for security analytics and a temporary attachment-scope feed into CloudWatch Logs for an investigation have different retention, cost and query profiles.
Account for the ingress and egress records when sizing anything — storage, Firehose throughput, an Athena partition strategy. The doubling is structural, not an anomaly.
Tag the flow logs. The docs note you can apply tags to flow logs, and with a 250-subscription ceiling per resource, knowing which subscription exists for which investigation is how you avoid hitting it.
Who should adopt this and when
Adopt now if you run Cloud WAN across more than two Regions and have ever had to reconstruct a cross-Region path by correlating VPC flow logs. This replaces that work with a field.
Adopt now if you have unexplained packet loss on a global path. The four loss counters are the most directly useful thing in the release, and MTU problems in particular are hard to find any other way.
Scope carefully if your core network carries high volume. Free at the source does not mean free, and two records per flow at Vended Logs rates on a busy core network is a real line item.
Wait if your reason for wanting it is a compliance assertion about segment isolation. The field you would cite is explicitly best effort; the core network policy is the evidence for that claim.
Key takeaways
The packet-header fields come from the packet, while the Cloud WAN metadata — segment, Region, attachment, service-insertion hops — is “best effort approximations” whose values “might be missing or inaccurate”. That is the sentence to carry away, because the metadata is the entire reason to use this rather than VPC flow logs.
Two scopes sit in the docs and not the announcement: subscriptions can only be created in a home Region, and Cloud WAN currently supports only US West (Oregon) as one. A global-coverage feature with a single-Region, unchangeable control plane.
And the cost shape is structural. A record is written at both the ingress and the egress attachment, so one flow is two records, at a destination Cloud WAN itself does not charge for. The three scopes are your cost control.
Official AWS references
- AWS Cloud WAN now supports Flow Logs — the announcement: the record contents including packet-loss counters and Cloud WAN metadata, the three destinations, the three enablement scopes, Region availability and the no-additional-charge statement
- AWS Cloud WAN Flow Logs — that metadata fields not from the packet header are best-effort approximations, that subscriptions can only be created in home Regions, the attachment-to-attachment model writing a record at each ingress and egress attachment, the four
log-statusvalues, the four packet-loss counters, the 250-subscription ceiling, the unsupported Tunnel-less Connect and Route Table attachment types, stale segment IDs during propagation, the default format's omission of the 1:1 NAT fields, the up-to-60-second timestamp skew, the ownership requirement, and the vended-logs pricing - What is AWS Cloud WAN? — that US West (Oregon) is currently the only supported home Region and that the home Region cannot be changed once established, plus the definitions of core network, core network edge, segment, attachment and network function group
- Logging IP traffic using VPC Flow Logs — the comparison point for what Cloud WAN flow logs add, and the vended-logs pricing model they share; no figures in this post are drawn from it
- AWS Cloud WAN service insertion — further reading on the network function groups that the
network-function-group-attachment-idsfield records; no claims in this post are drawn from it
Comments