Executive summary
AWS has launched Amazon CloudWatch Omni, described as “an AI-powered observability experience organized around your teams and the applications they run.” Generally available today.
The headline is scope. It “combines the interoperability of OpenTelemetry with the scale and reliability of CloudWatch”, “automatically discovers services, maps dependencies, and surfaces golden metrics”, and reaches “across your AWS accounts and Regions, as well as other clouds, including Azure workloads.”
The part worth the most attention is the agent story: “a dedicated agent observability experience with an evaluation-driven development workflow” covering “every prompt, model call, and tool invocation.” That is the telemetry an LLM application actually needs, and it is also a description of user input being recorded.
What changed
A new surface, not a new tab. Omni is “a standalone web experience with single sign-on (SSO)”, entered by creating an “Omni space from the CloudWatch console” and configuring SSO. There is also “a local IDE extension” — free, for VS Code, Cursor and Kiro.
That matters for access control. Omni is reached through its own sign-on rather than inheriting whoever could already open CloudWatch, which is a boundary to design rather than one you get by default.
Agent-native observability. Prompts, model calls and tool invocations as first-class telemetry, with an evaluation workflow around them. This is the gap teams running agents have been filling with bespoke logging.
Three Regions. “US East (N. Virginia), US West (Oregon) and Europe (Ireland).” Note the asymmetry: it observes every Region and other clouds, from three.
Architecture
The useful way to look at this is to follow where a prompt ends up.
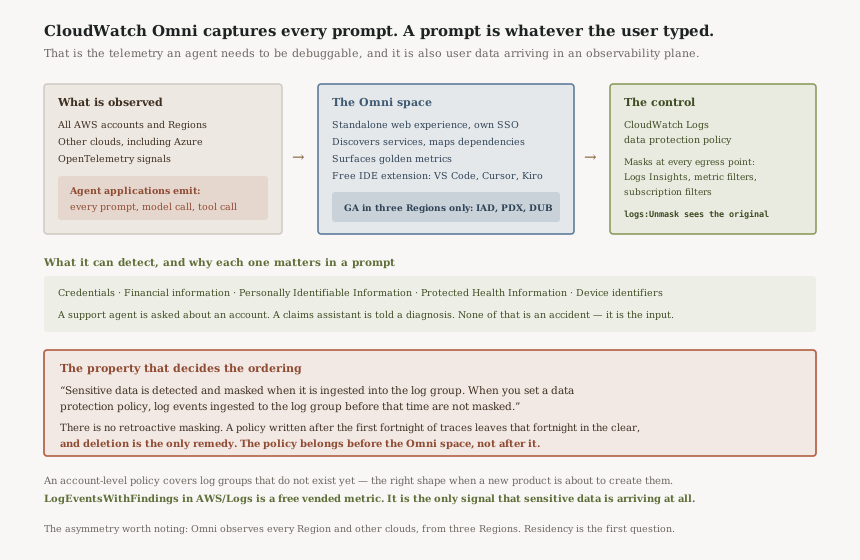
An agent's telemetry is not like a service's. A latency metric is a number; a prompt is a sentence somebody typed. When Omni captures “every prompt, model call, and tool invocation”, the resulting trace contains whatever the user put in the box — which for a support agent, a claims assistant or an internal helpdesk is names, reference numbers, and sometimes health or financial detail.
That is not a flaw in Omni. It is the nature of the signal: you cannot debug an agent without seeing what it was asked. But it moves a category of data into an observability plane, and observability planes are widely readable by design.
Business value
Agent debugging today is mostly reconstruction — piecing together what was asked, which tool ran, and what came back, from logs that were never designed to answer that question. An evaluation-driven workflow over first-class prompt and tool-call telemetry removes that reconstruction.
The cross-cloud reach is the second real gain. Telemetry “across your AWS accounts and Regions, as well as other clouds, including Azure workloads” addresses the common case honestly: most estates running agents are not single-cloud, and correlating across them has meant a third-party tool.
And automatic discovery — “discovers services, maps dependencies, and surfaces golden metrics” — is the part that decides whether an observability product is used or abandoned. Instrumented-by-default beats a dashboard someone has to build.
Security considerations
This is where the work is, and the control already exists in CloudWatch Logs: data protection policies, which “let you audit and mask sensitive data that appears in log events.”
They cover the categories that matter here — “Credentials… Financial information… Personally Identifiable Information (PII)… Protected Health Information (PHI)… Device identifiers” — and they mask “at all egress points, including CloudWatch Logs Insights, metric filters, and subscription filters”, with “only users who have the logs:Unmask IAM permission” able to see the original.
AWS states it plainly: “Sensitive data is detected and masked when it is ingested into the log group. When you set a data protection policy, log events ingested to the log group before that time are not masked.” There is no retroactive masking. A policy applied after the first fortnight of agent traces leaves that fortnight unmasked, and the only remedy is deletion. So with a product that captures every prompt, the policy is not a follow-up task — it belongs before the first trace.
Two details make that easier. An account-level policy “applies to both existing log groups and log groups that are created in the future”, which is the right shape when you do not yet know which log groups Omni will produce. And the LogEventsWithFindings metric in the AWS/Logs namespace tells you it is firing — “vended metrics and… free of charge”, so there is no reason not to alarm on it.
Cost considerations
The announcement points at a CloudWatch Omni pricing page rather than stating a model, so there is nothing to quote and nothing I will guess at. Check it before enabling broadly.
What is predictable is volume. Prompt-and-response telemetry is verbose compared with metrics: a single agent turn can carry several kilobytes of text where a latency datapoint carries a number. Any estimate built from existing CloudWatch spend will understate an agent workload.
The masking side is free — the detection metric is vended, and masking is supported on “both the Standard and Infrequent Access log classes”, so choosing the cheaper class does not cost you the protection.
Operational considerations
Three Regions, observing everywhere. Omni runs in N. Virginia, Oregon and Ireland while collecting from all your accounts and Regions plus other clouds. For most teams that is convenient centralisation. For anyone with data-residency obligations it is the first question to answer, because the telemetry — including prompts — is being aggregated somewhere specific.
SSO is a new access decision. An Omni space is entered through its own sign-on. Who gets in is not inherited from existing CloudWatch permissions, and given what agent traces contain, that list deserves to be shorter than the list of people who can read metrics.
The IDE extension puts production telemetry on laptops. A free extension for VS Code, Cursor and Kiro is genuinely useful for working on agents. It is also a path from production traces to a developer machine, which is worth deciding deliberately rather than discovering.
One policy per log group. “Each log group can have only one log group-level data protection policy”, with a limit of 30,720 characters. Generous, but it means the account-level policy and the log-group policy have to be designed together rather than accumulated.
Tradeoffs
You cannot debug an agent without seeing the prompt. That is the whole trade, and it does not resolve cleanly. Masking PII in traces protects users and removes exactly the detail that sometimes explains the failure. The honest position is that both are true and the balance is a policy decision, not a technical one.
A separate surface is clearer and easier to forget. Standalone SSO means cleaner access control and one more place to audit, offboard from, and remember exists.
Centralisation buys correlation and concentrates exposure. Aggregating across accounts, Regions and clouds is what makes the product useful, and it also means one space holds telemetry from all of them.
Implementation guidance
Write the data protection policy before creating the Omni space. Masking is not retroactive. This is the only step whose ordering genuinely cannot be fixed later.
Use an account-level policy. It covers log groups that do not exist yet, which is the situation you are in before a new product starts emitting.
Alarm on LogEventsWithFindings. It is free, and it is the only signal that tells you sensitive data is reaching the telemetry at all — which is worth knowing whether or not it is being masked correctly.
Decide the SSO list separately from CloudWatch access. Agent traces are more sensitive than metrics; the access lists should reflect that rather than defaulting to the same group.
Treat logs:Unmask as a privileged permission. It is the difference between reading masked traces and reading what users typed.
Best practices
Instrument first, protect first, then enable. The ordering matters exactly once, and it is now.
Assume prompt telemetry is user data, because it is. Whatever your handling rules are for user-submitted text, they now apply to an observability system.
Check the pricing page against agent volumes, not service volumes. Text-shaped telemetry does not scale like metrics.
Who should adopt this
Available today in three Regions, with an Omni space to create and SSO to configure — so unlike most releases this one requires a deliberate setup step.
It is worth evaluating now if you run LLM agents in production and have been building prompt logging by hand, or if you correlate telemetry across AWS and Azure. It is worth waiting on if you have unresolved data-residency constraints, since the aggregation Regions are fixed at three, or if nobody has yet decided how prompt content is classified in your organisation.
Key takeaways
- CloudWatch Omni is generally available: AI-powered observability organised around teams and applications, combining OpenTelemetry with CloudWatch.
- It auto-discovers services, maps dependencies and surfaces golden metrics across accounts, Regions and other clouds including Azure.
- The agent experience captures every prompt, model call and tool invocation, with an evaluation-driven workflow.
- It is a standalone web experience with its own SSO, plus a free IDE extension for VS Code, Cursor and Kiro.
- Three Regions only: N. Virginia, Oregon, Ireland — observing everywhere from three places.
- Prompt telemetry is user input. CloudWatch Logs data protection policies are the control, covering credentials, financial, PII, PHI and device identifiers.
- Masking happens at ingestion and is not retroactive — events ingested before the policy was set are never masked.
LogEventsWithFindingsinAWS/Logsis free and tells you sensitive data is arriving.
Comments