📋 In This Post
Lab Overview
Almost everything written about Azure Monitor managed service for Prometheus
assumes Kubernetes. The add-on scrapes AKS. The sample dashboards are cluster
dashboards. The rule groups take a clusterName. Read enough of it
and you come away believing the managed service is a Kubernetes
feature.
It isn't, and this week is the test. There is no cluster anywhere in
it. A self-managed Prometheus runs on one ordinary Linux VM and pushes
its metrics into an Azure Monitor workspace using Prometheus's own
remote_write. Microsoft documents exactly this: remote-write sends
metrics "from self-managed Prometheus running in your Kubernetes clusters
or virtual machines", and user-assigned managed identity authentication
lists Azure VM/VMSS among its supported targets.
The objective, in one sentence: get a metric produced on a VM into Azure's managed Prometheus store and prove it arrived, without a password, a certificate or a client secret existing anywhere. Expected outcome: a series queryable from the workspace carrying labels identifying the VM it came from, a Terraform-defined alert and recording rule evaluating against it, and a Grafana panel drawing the same data.
| Difficulty | Intermediate |
|---|---|
| Completion time | About 90 minutes, of which 30 is waiting — see Troubleshooting |
| Deployment | Terraform, one apply, state in HCP Terraform (local execution) |
| Source | week-11-managed-prometheus · runbook in LAB.md |
Cloud Services and Concepts
| Service | Its job here | What it is |
|---|---|---|
| Azure Monitor workspace | stores the Prometheus time series | A metrics store queried with PromQL. Not a Log Analytics workspace: Microsoft's own note is that those hold logs and metrics from many resources, while Azure Monitor workspaces "currently contain only metrics related to Prometheus". |
| Data collection rule (DCR) | accepts the write | Created automatically by the workspace. It exposes the ingestion endpoint Prometheus posts to, and it is what the publishing permission is granted on. |
| User-assigned managed identity | what Prometheus authenticates as | An Entra identity attached to the VM, so Prometheus asks the instance metadata service for a token and never stores one. |
Prometheus remote_write |
ships the samples | A Prometheus feature that forwards samples to remote storage; the azuread: block makes it speak to Azure. |
| Prometheus rule group | alerts and recording rules, as code | An Azure resource evaluating PromQL against the workspace. clusterName is optional — the whole point here. |
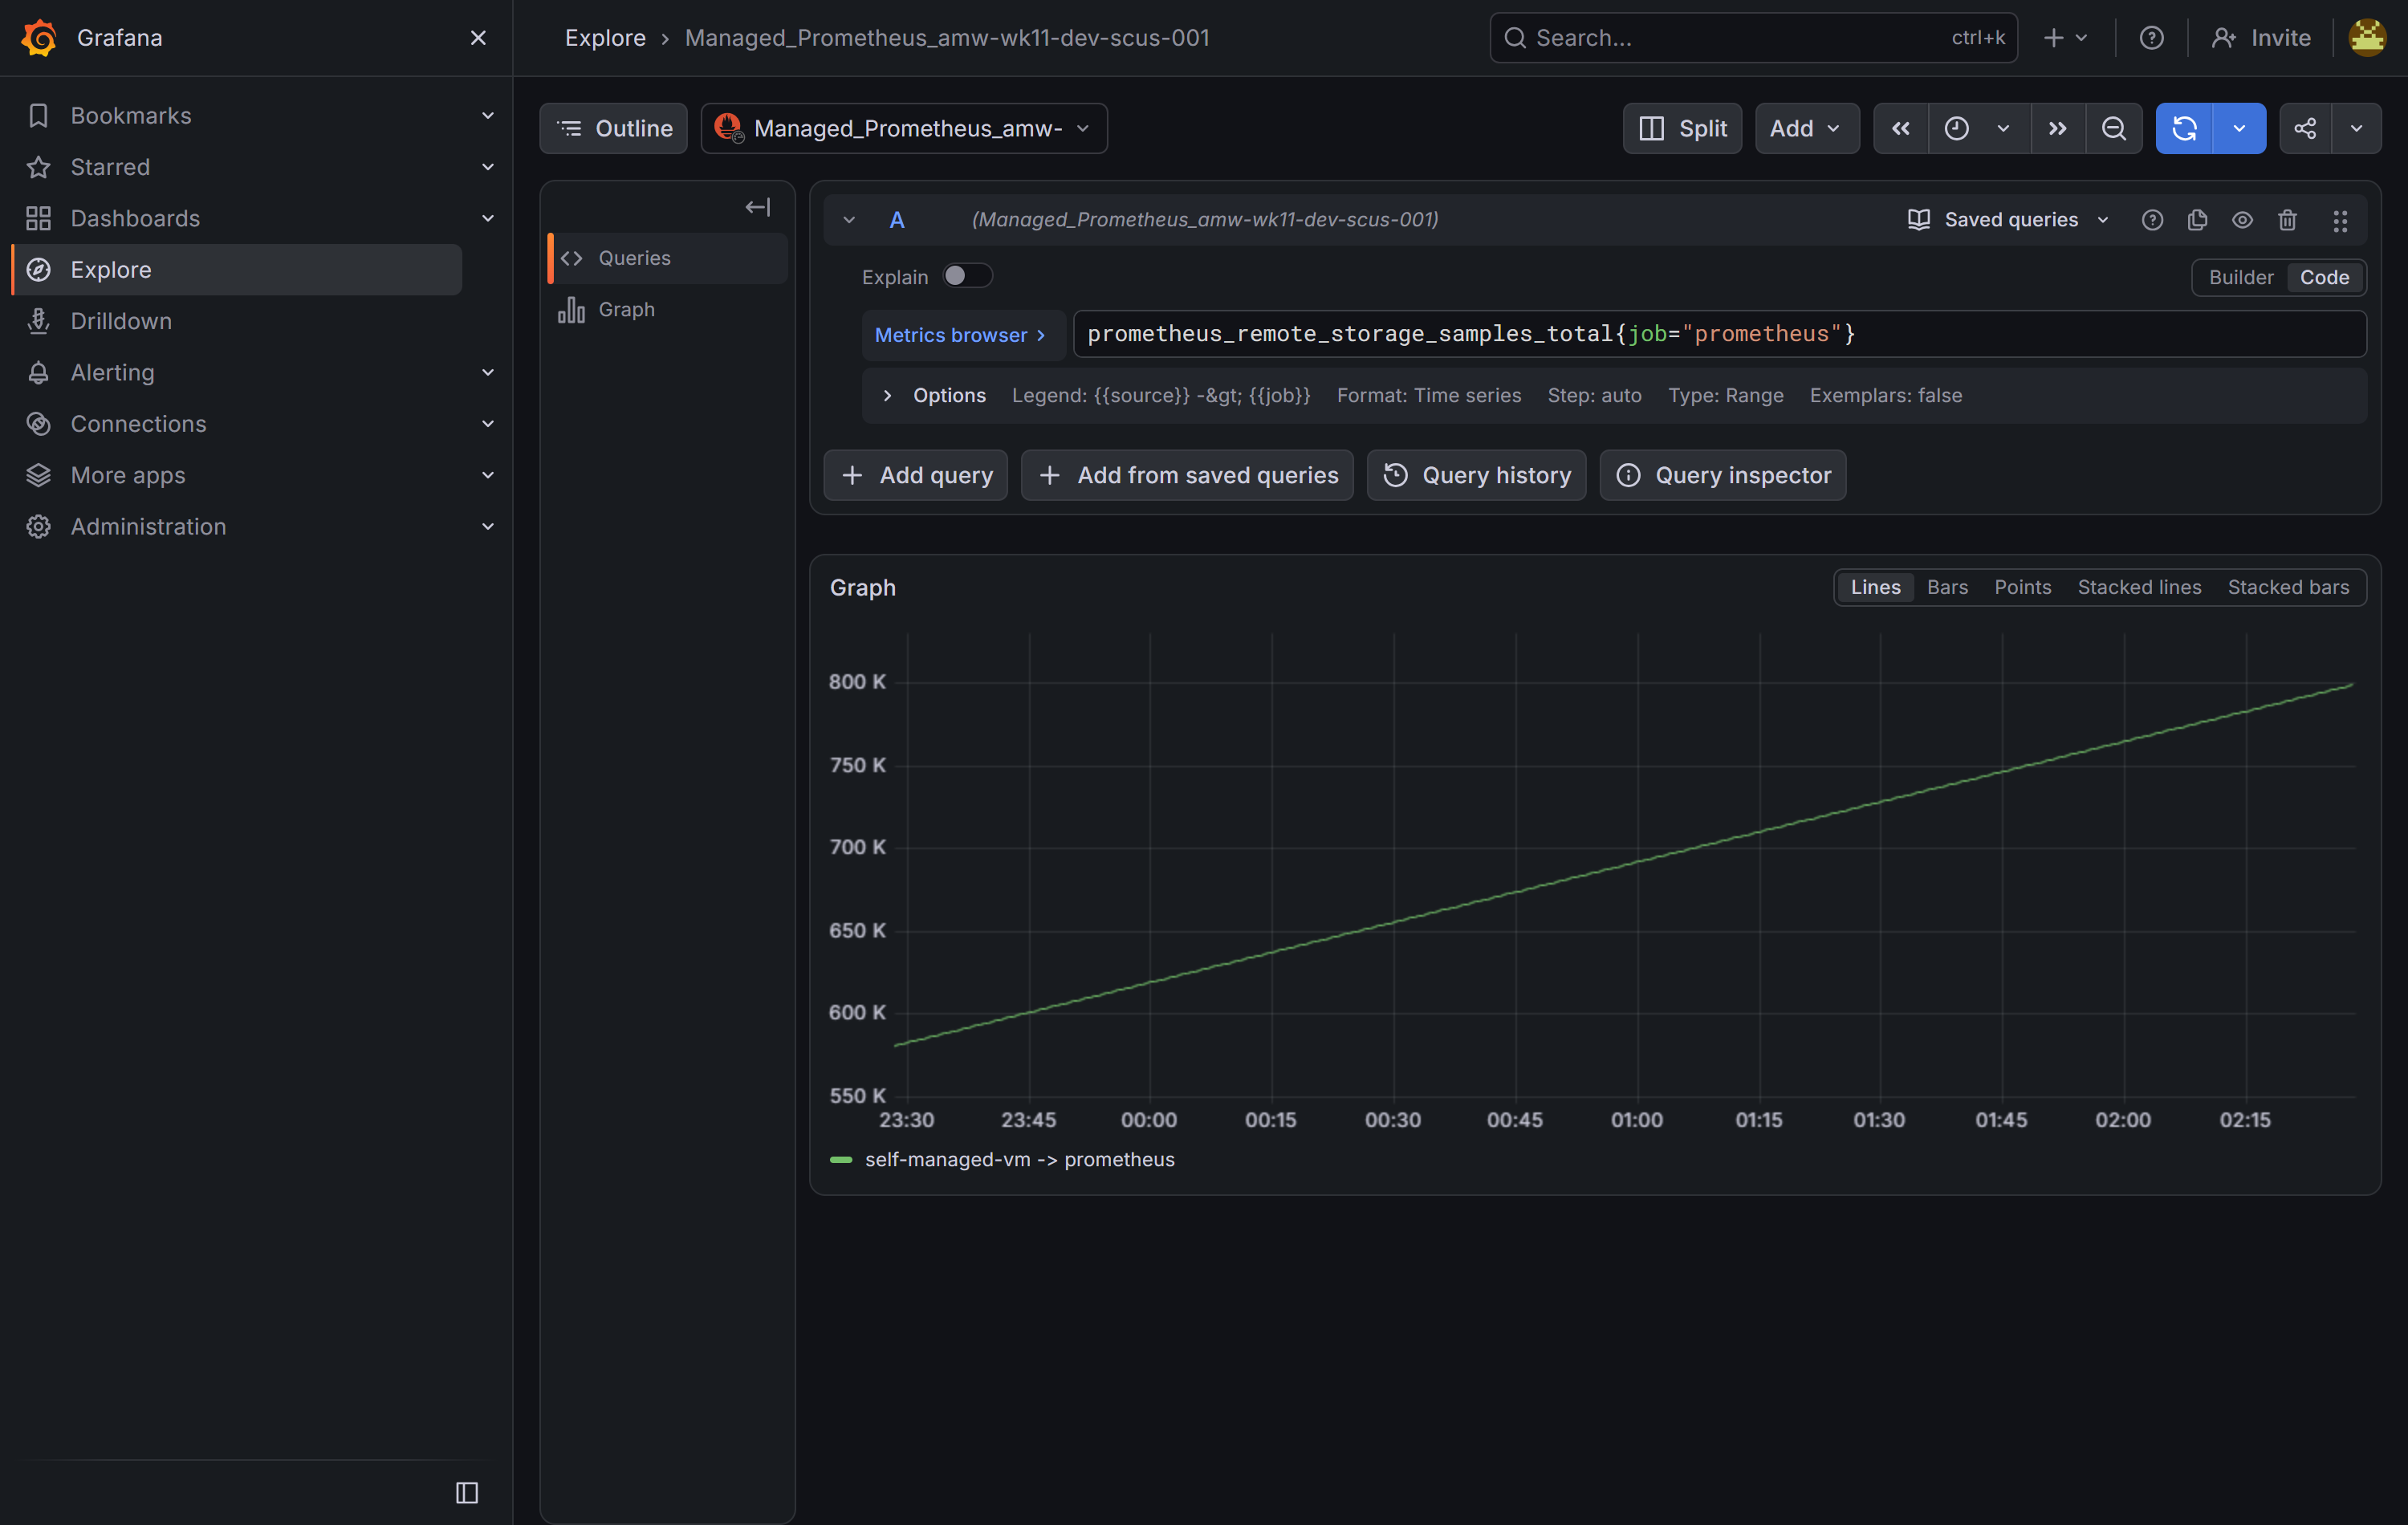
| Azure Managed Grafana | draws it | Hosted Grafana that can be wired to the workspace as a data source at deploy time. |
Architecture and Workflow
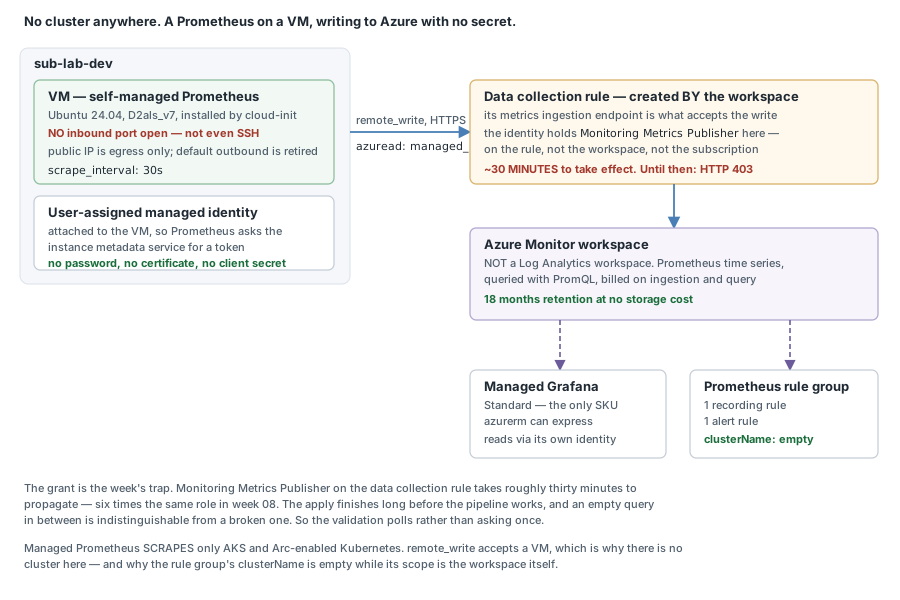
- Prometheus on the VM scrapes its own
/metricsevery 30 seconds. - It asks the instance metadata service for a token, because a user-assigned managed identity is attached to the VM.
- It
remote_writes the samples over HTTPS to the metrics ingestion endpoint of the workspace's data collection rule. - The DCR accepts the write — but only because the identity holds Monitoring Metrics Publisher on that rule.
- The workspace stores the series and stamps its own resource id onto every one of them.
- A Prometheus rule group evaluates one recording rule and one alert rule against the workspace.
- Grafana reads the workspace through a separate identity holding Monitoring Data Reader.
The decisions worth defending. The permission is granted on the data collection rule, not the workspace and not the subscription, because the rule is the thing that accepts the write — anything wider is scope nobody needs. The identity is user-assigned rather than system-assigned so it outlives the VM; rebuild the host and the grant still points at something that exists. And the authentication is a managed identity rather than the Entra ID option Microsoft also documents, because that option requires a client secret — the lab forbids those outright, which makes the choice automatic rather than clever.
Prerequisites
- An Azure subscription, with Contributor plus User Access Administrator — the lab creates three role assignments and Contributor alone cannot.
- Terraform ≥ 1.10 and
hashicorp/azurerm~> 5.2. Thecheckblock below needs 1.5+. - An existing SSH public key. Azure requires a key or a password on a Linux VM; Terraform does not generate one here, because a generated key puts its private half in state.
- Resource providers
Microsoft.Monitor,Microsoft.Dashboard,Microsoft.AlertsManagement,Microsoft.Insights,Microsoft.Compute,Microsoft.Network,Microsoft.ManagedIdentity. - No cluster, no Entra licence, no prior lab. This week stands alone.
One prerequisite is a trap rather than a checkbox: VM size.
Three walls decided this lab's, and none announced itself clearly.
Standard_B2s is not offered in the region, but fails with
SkuNotAvailable ... Capacity Restrictions, which reads like a
temporary shortage. Every v2 B-series family had a vCPU quota of
zero here, while az vm list-skus reported them
unrestricted — SKU restrictions and quota are different systems, and
quota is only evaluated at create time. And p-suffixed sizes are
ARM64, which boot perfectly and then cannot run an amd64
binary.
Implementation
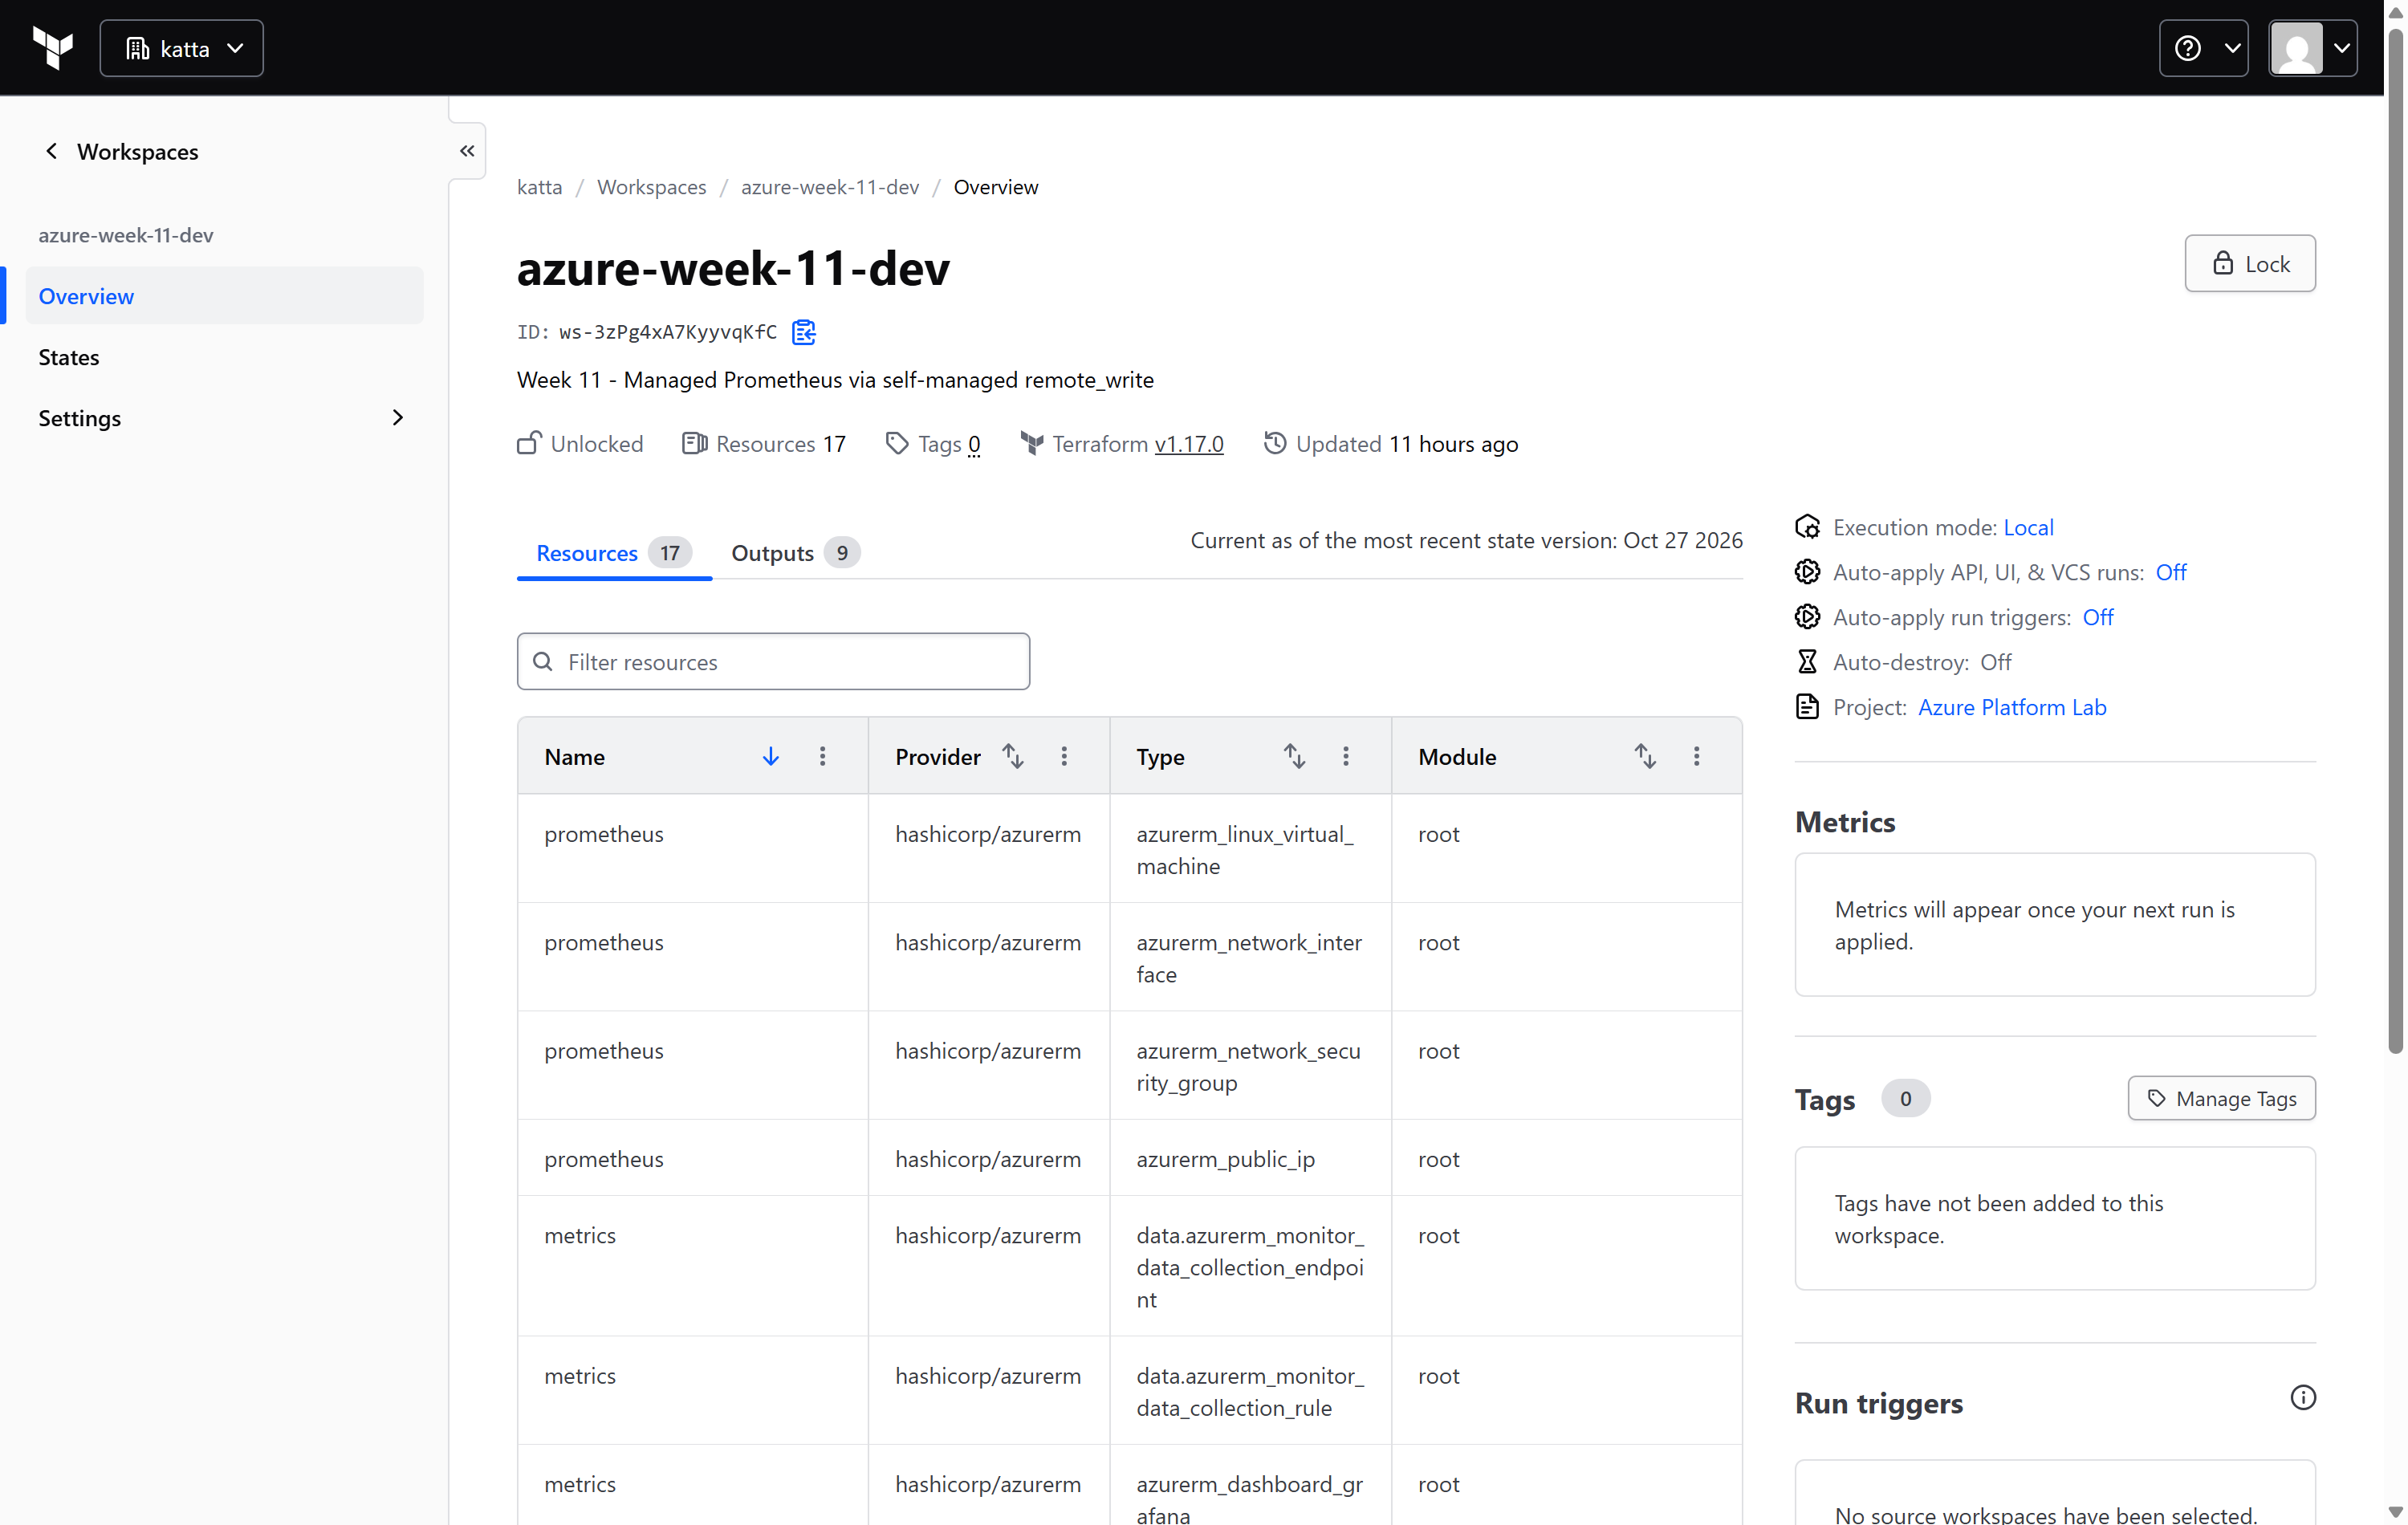
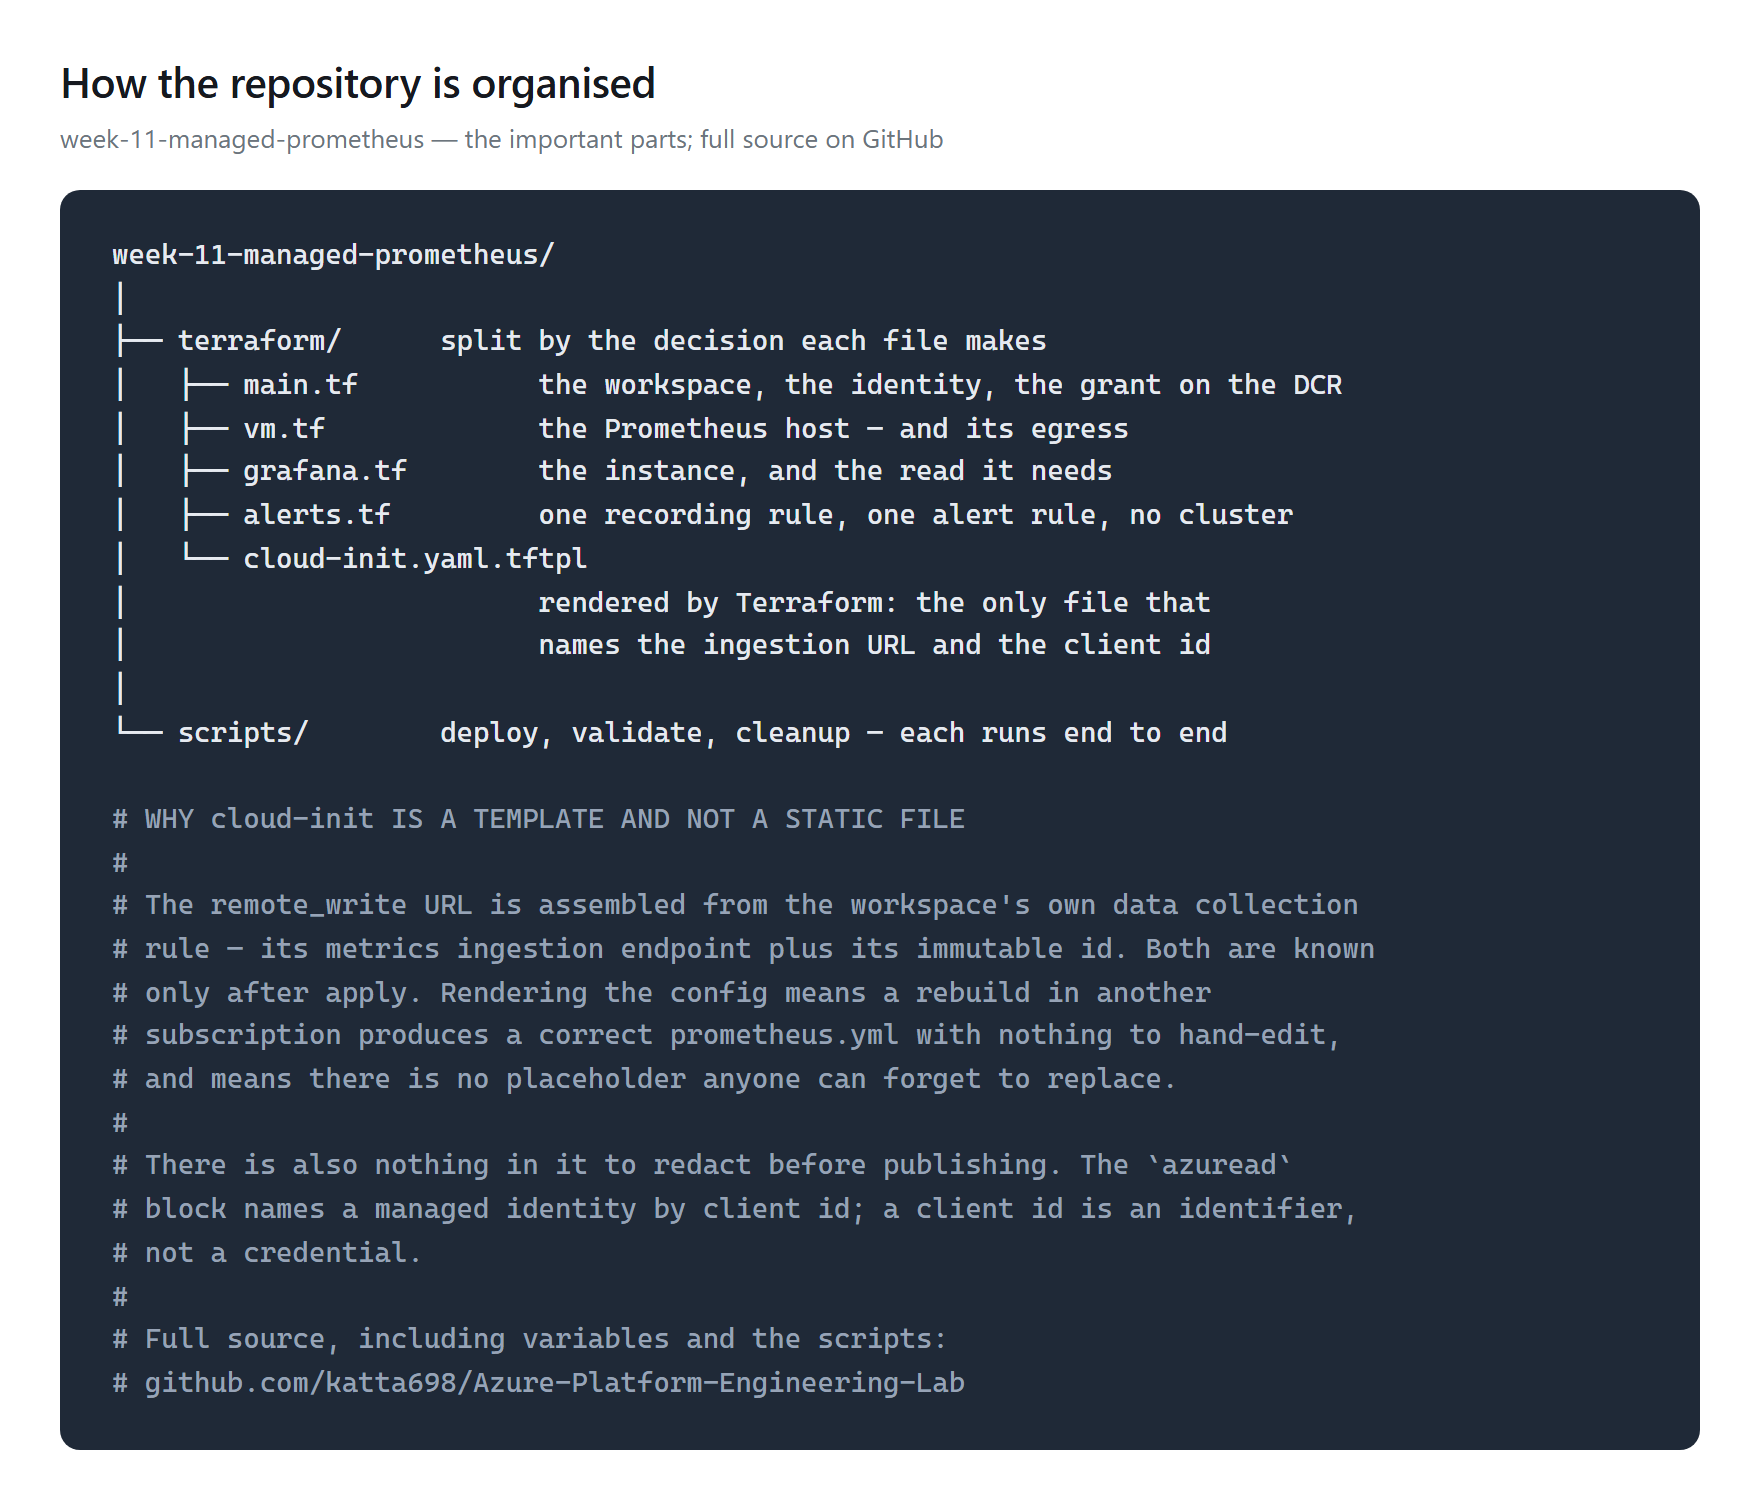
The remote-write URL is assembled, never pasted. Its host comes from the data collection endpoint; its path names the data collection rule by its immutable id, which is not the rule's resource name. Both are read back from the deployed workspace, so a rebuild in another subscription renders a correct config with nothing to hand-edit:
locals {
  remote_write_url = join("", [
    data.azurerm_monitor_data_collection_endpoint.metrics.metrics_ingestion_endpoint,
    "/dataCollectionRules/",
    data.azurerm_monitor_data_collection_rule.metrics.immutable_id,
    "/streams/Microsoft-PrometheusMetrics/api/v1/write?api-version=2023-04-24",
  ])
}
That join hides a trap worth four lines of defence. The rule data
source also exposes a metrics_ingestion_endpoint attribute, and
for a workspace-managed rule it comes back empty. Terraform
cheerfully joins an empty host onto a path, applies, boots — and
Prometheus fails hours later with unsupported protocol scheme "".
An empty string is a valid string, so nothing warns. So the plan now
refuses:
check "remote_write_url_is_absolute" {
  assert {
    condition     = startswith(local.remote_write_url, "https://")
    error_message = "The assembled remote_write URL has no scheme - the DCE's metrics_ingestion_endpoint came back empty."
  }
}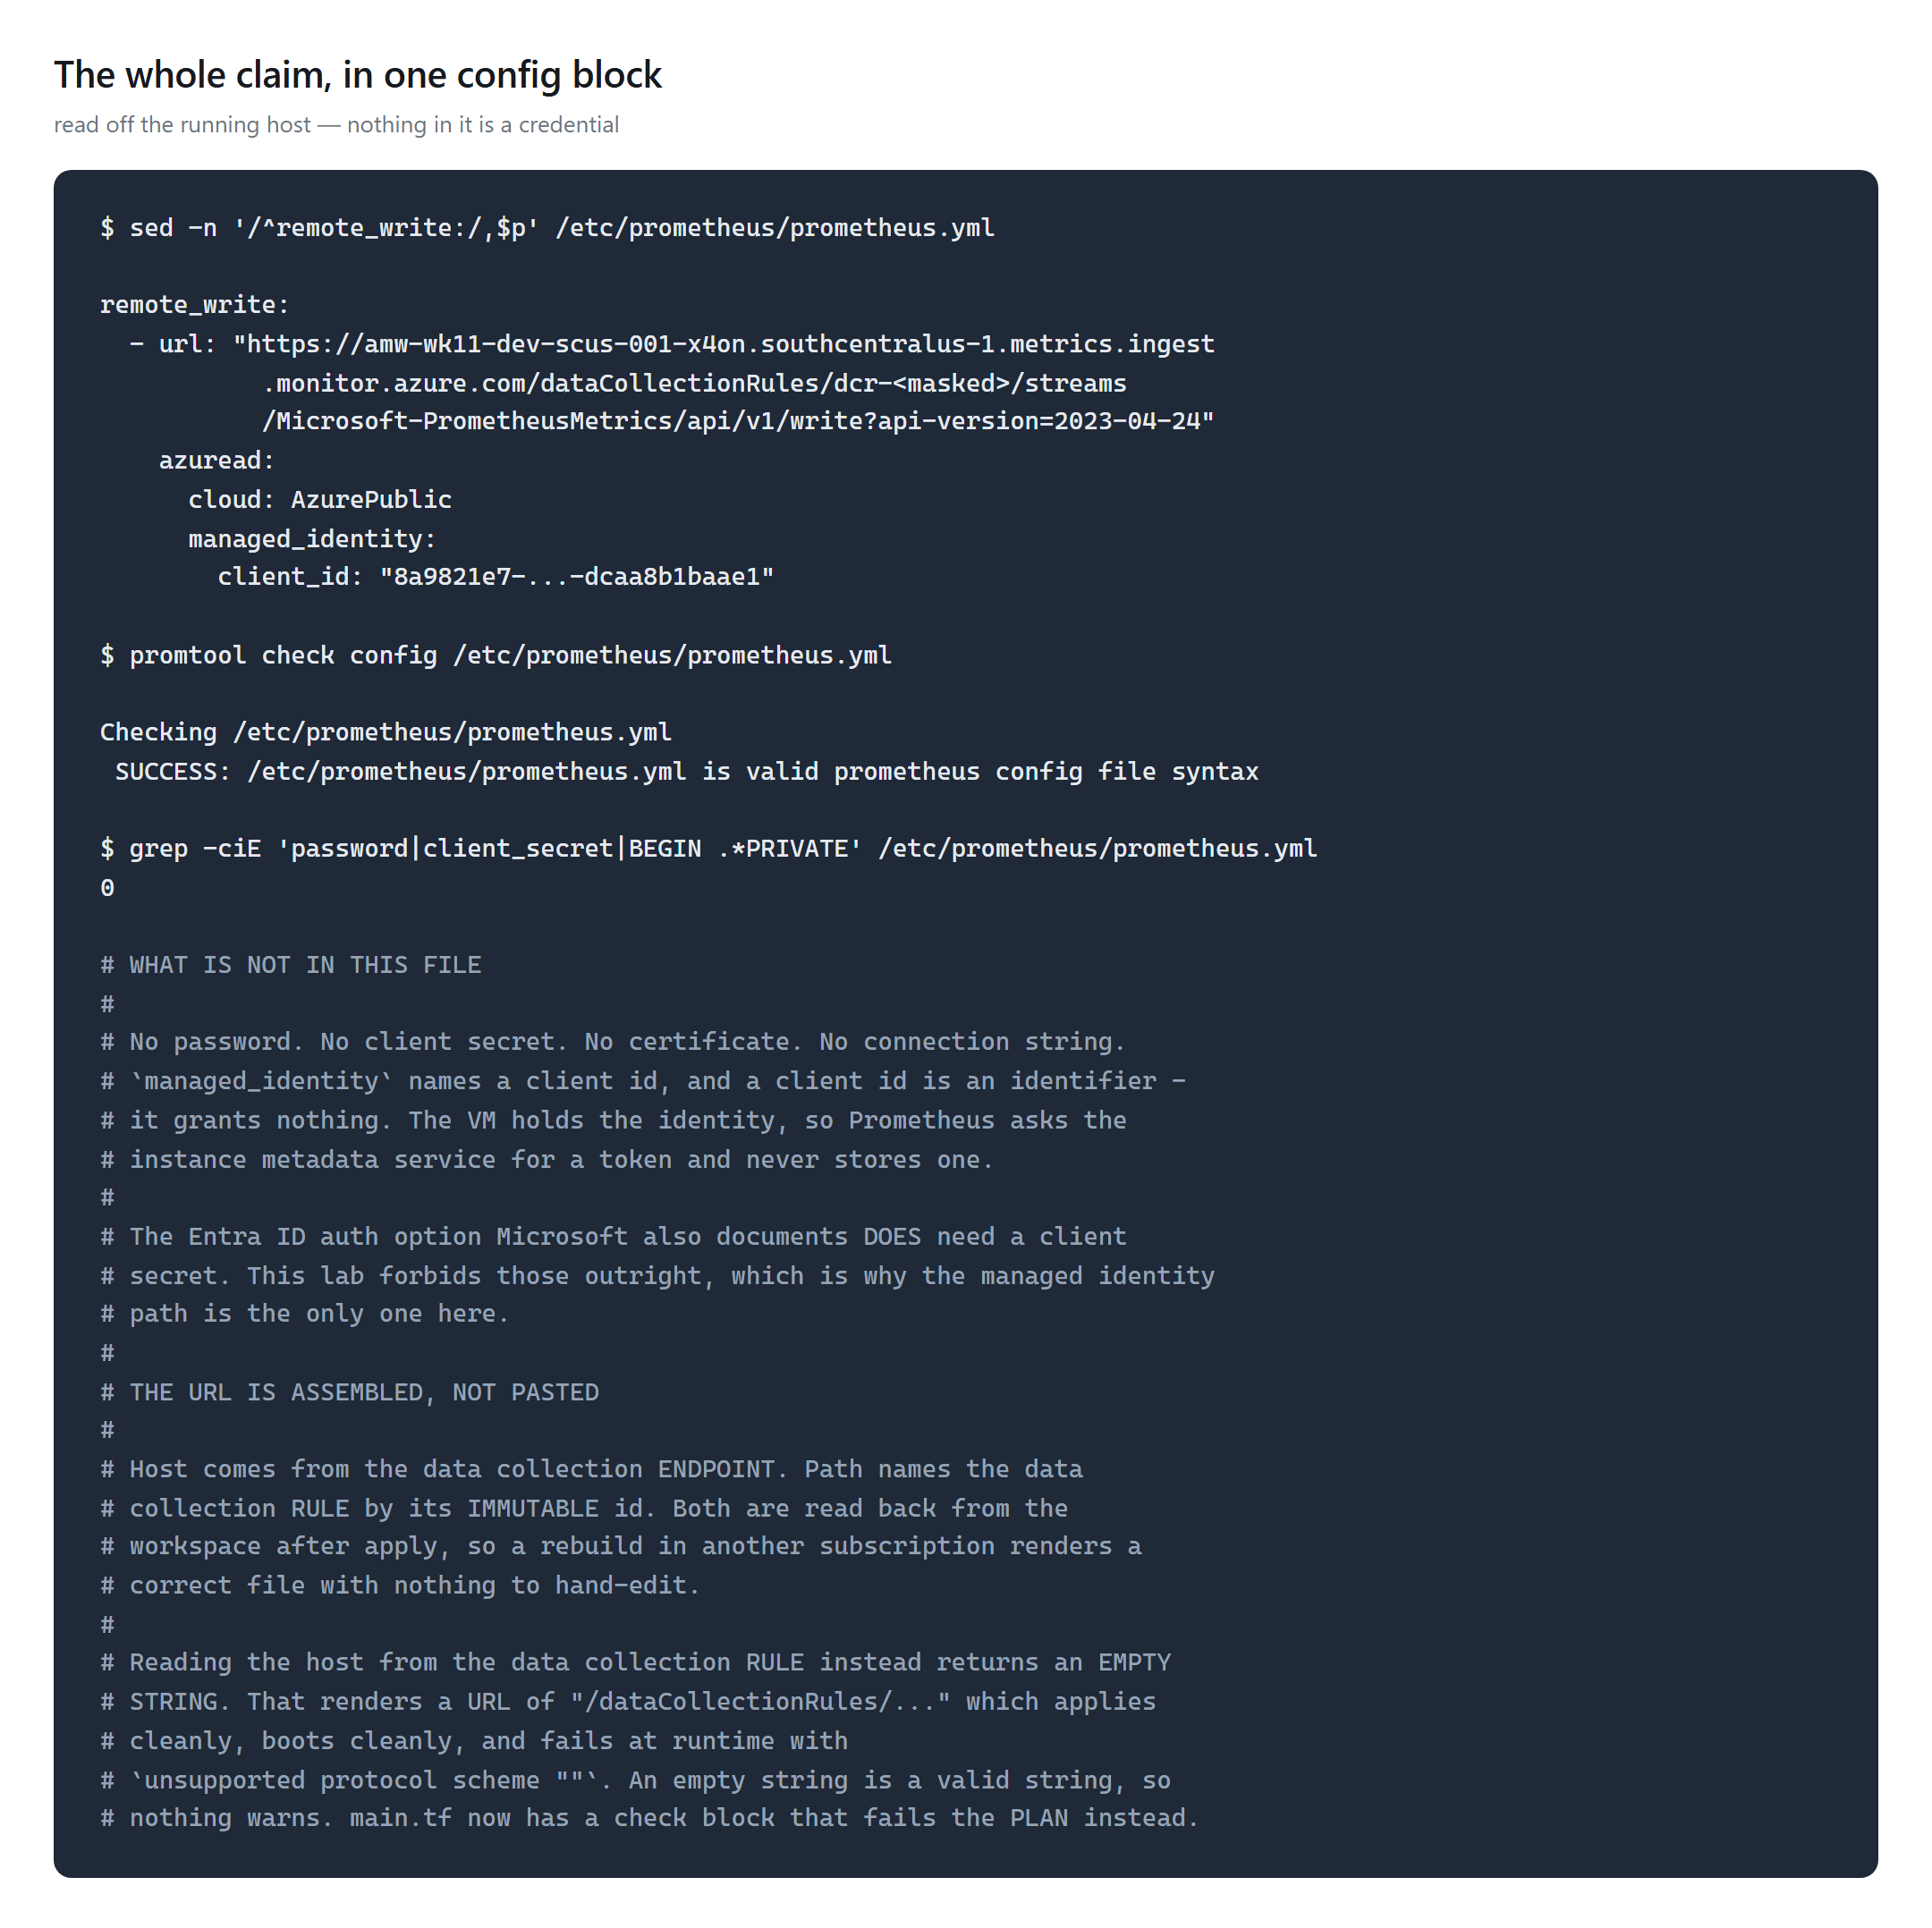
managed_identity names a client id, and a client id is an
identifier, not a credential. The grep for passwords and secrets returns
0.The alert and recording rules are the other half. Both live in one
azurerm_monitor_alert_prometheus_rule_group whose
scopes is the workspace and whose cluster_name is
deliberately unset — the provider makes it optional, and leaving it empty
is what demonstrates that managed Prometheus rules do not require a
cluster.
Validation and Evidence
./scripts/validate.sh — 7 passed, 0
failed.
| Test | Expected | Actual | Status |
|---|---|---|---|
| ARM type of the workspace | microsoft.monitor/accounts | microsoft.monitor/accounts | PASS |
| Scope of Monitoring Metrics Publisher | on the DCR, 0 at subscription scope | 1 on the DCR, 0 at subscription | PASS |
prometheus.yml on the running host | no password, secret or private key | 0 matches | PASS |
| NSG inbound allow rules | none | none | PASS |
| A VM-written series queryable from the workspace | at least one series | up{job="prometheus"} = 1 | PASS |
| Rule group contents | 2 rules, no clusterName | 1 recording + 1 alert, no cluster | PASS |
| Grafana data source | points at this week's workspace | Managed_Prometheus_amw-wk11-... | PASS |
Two deserve a note. The config check reads the file on the running
host through az vm run-command, not from the template,
because the question is what actually deployed — and no SSH port is open
to read it any other way. The series check polls, 40 times at
60-second intervals, for reasons the next section explains.
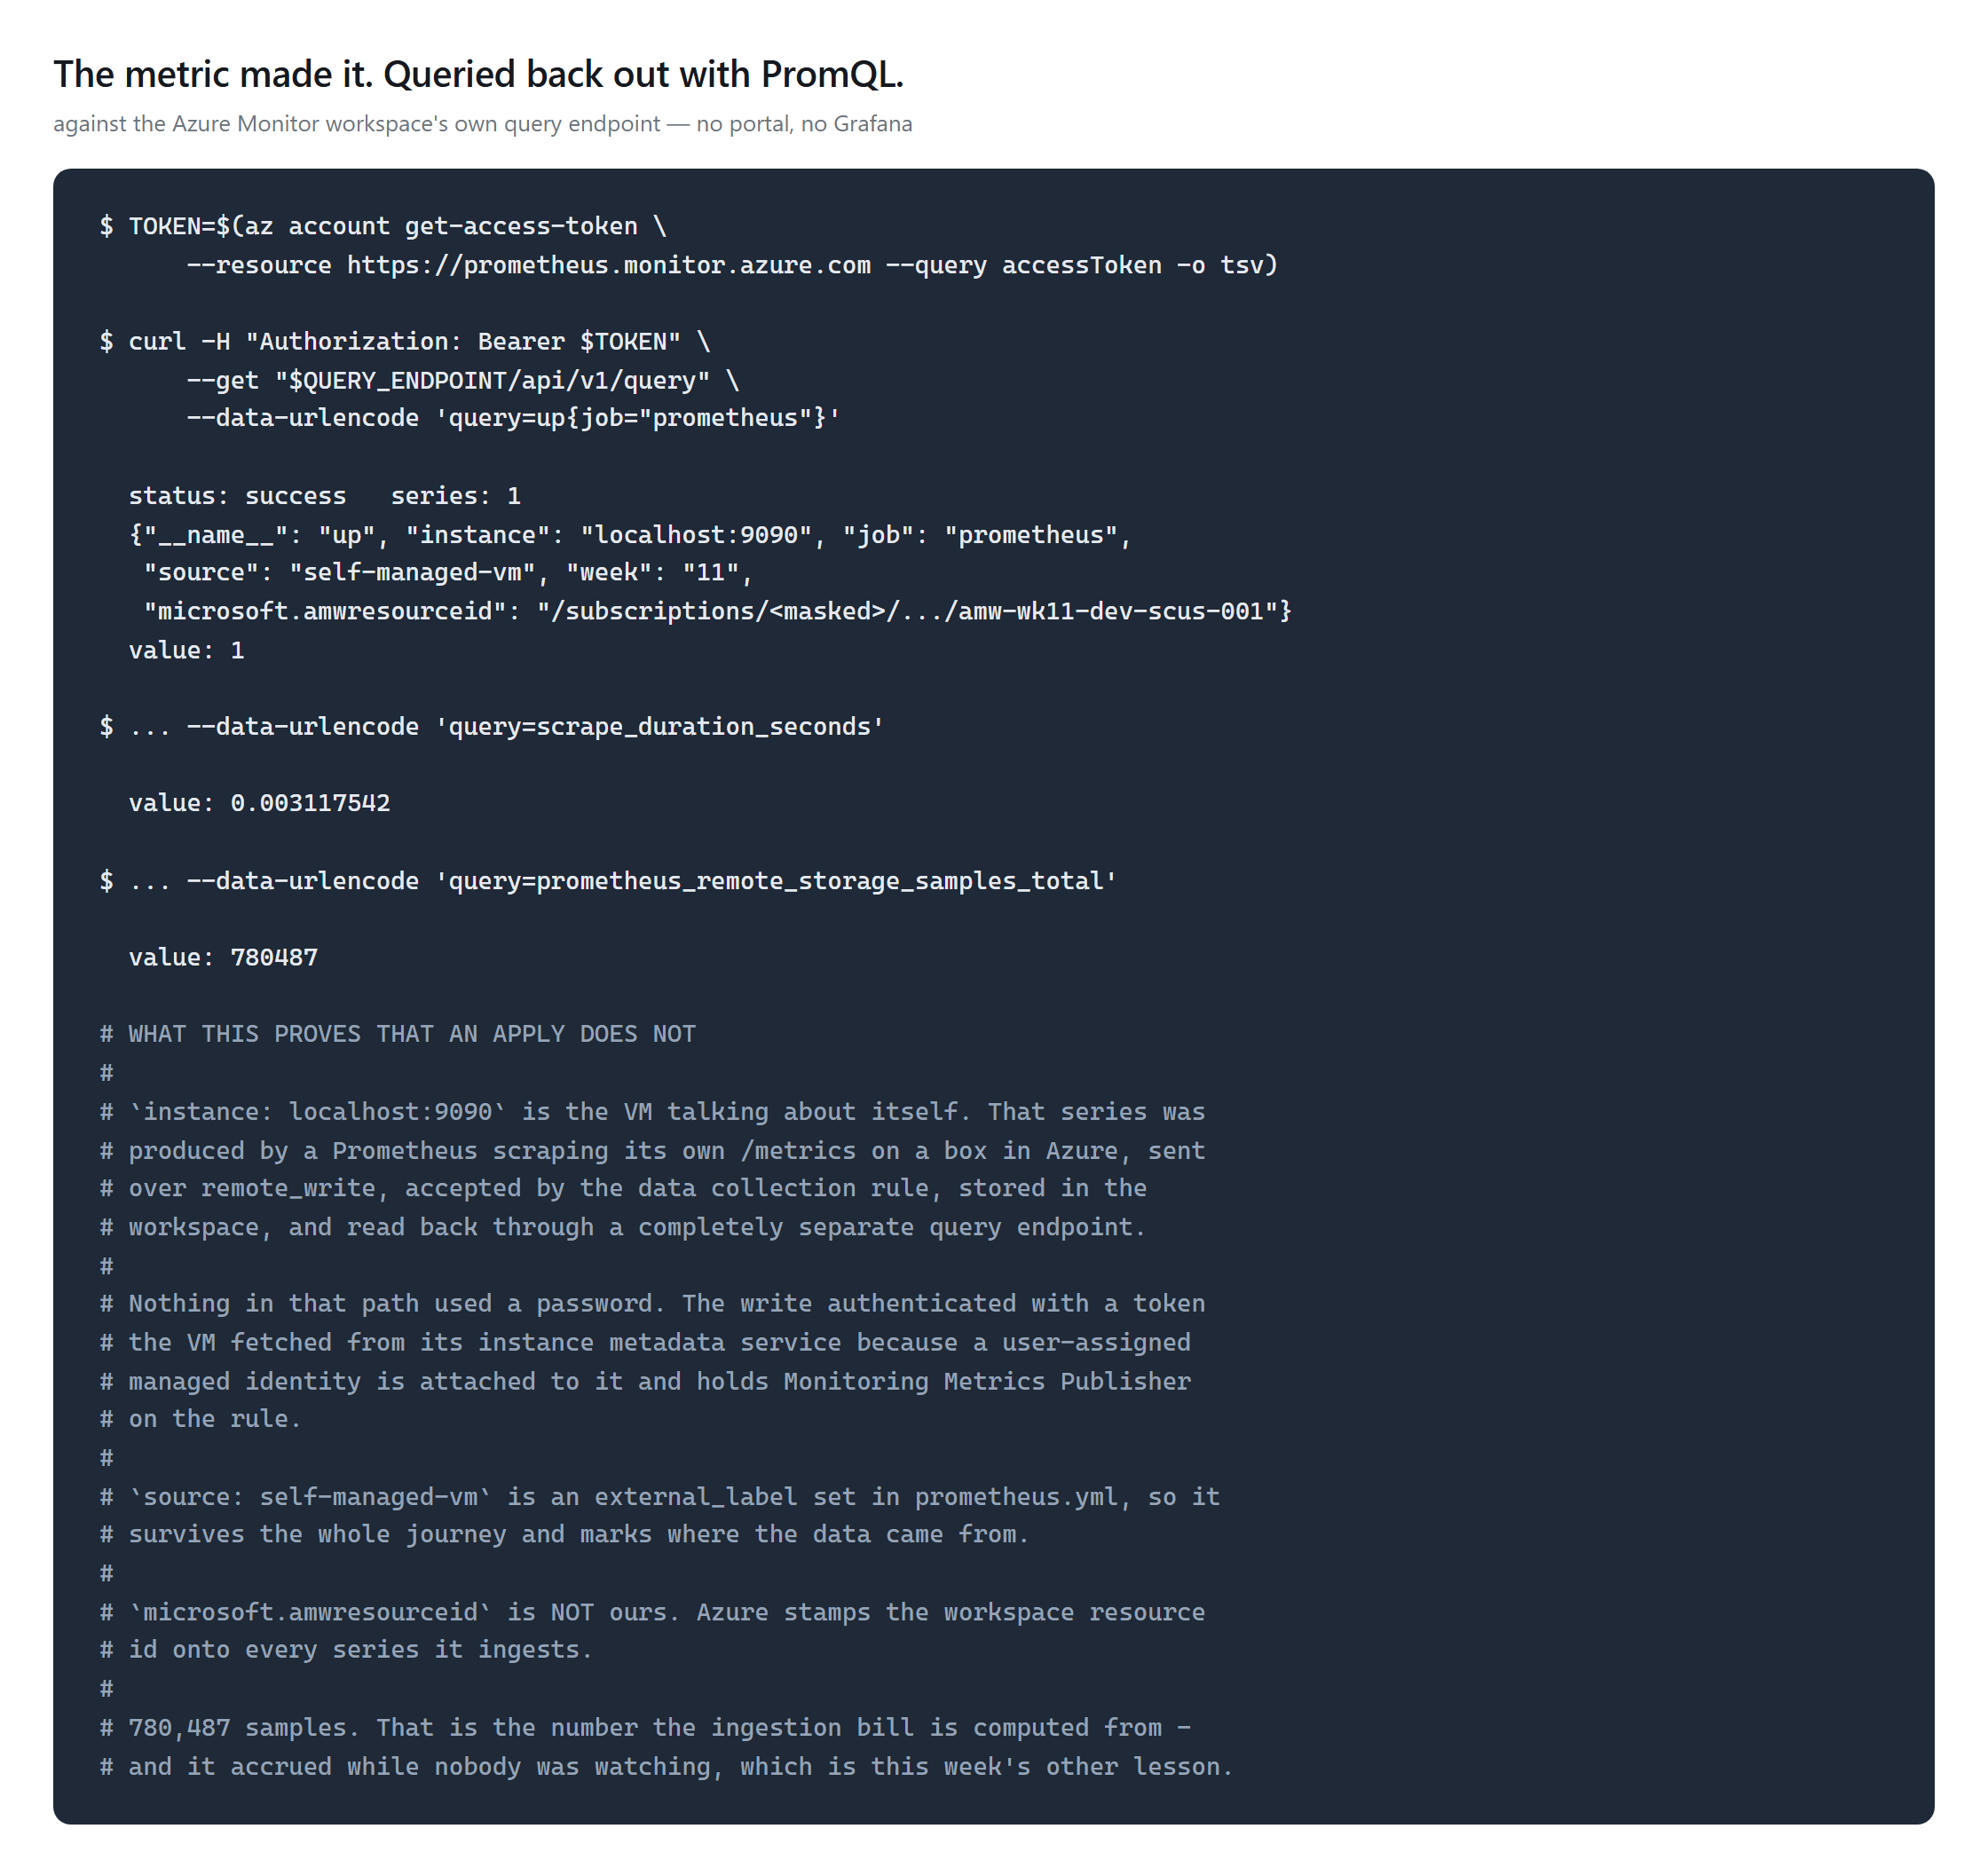
instance: localhost:9090 is the VM talking about itself.
source: self-managed-vm is an external_label from
prometheus.yml, so provenance survives the whole journey. And
this is the query endpoint — a different host from the one the
write used, so both halves are demonstrated.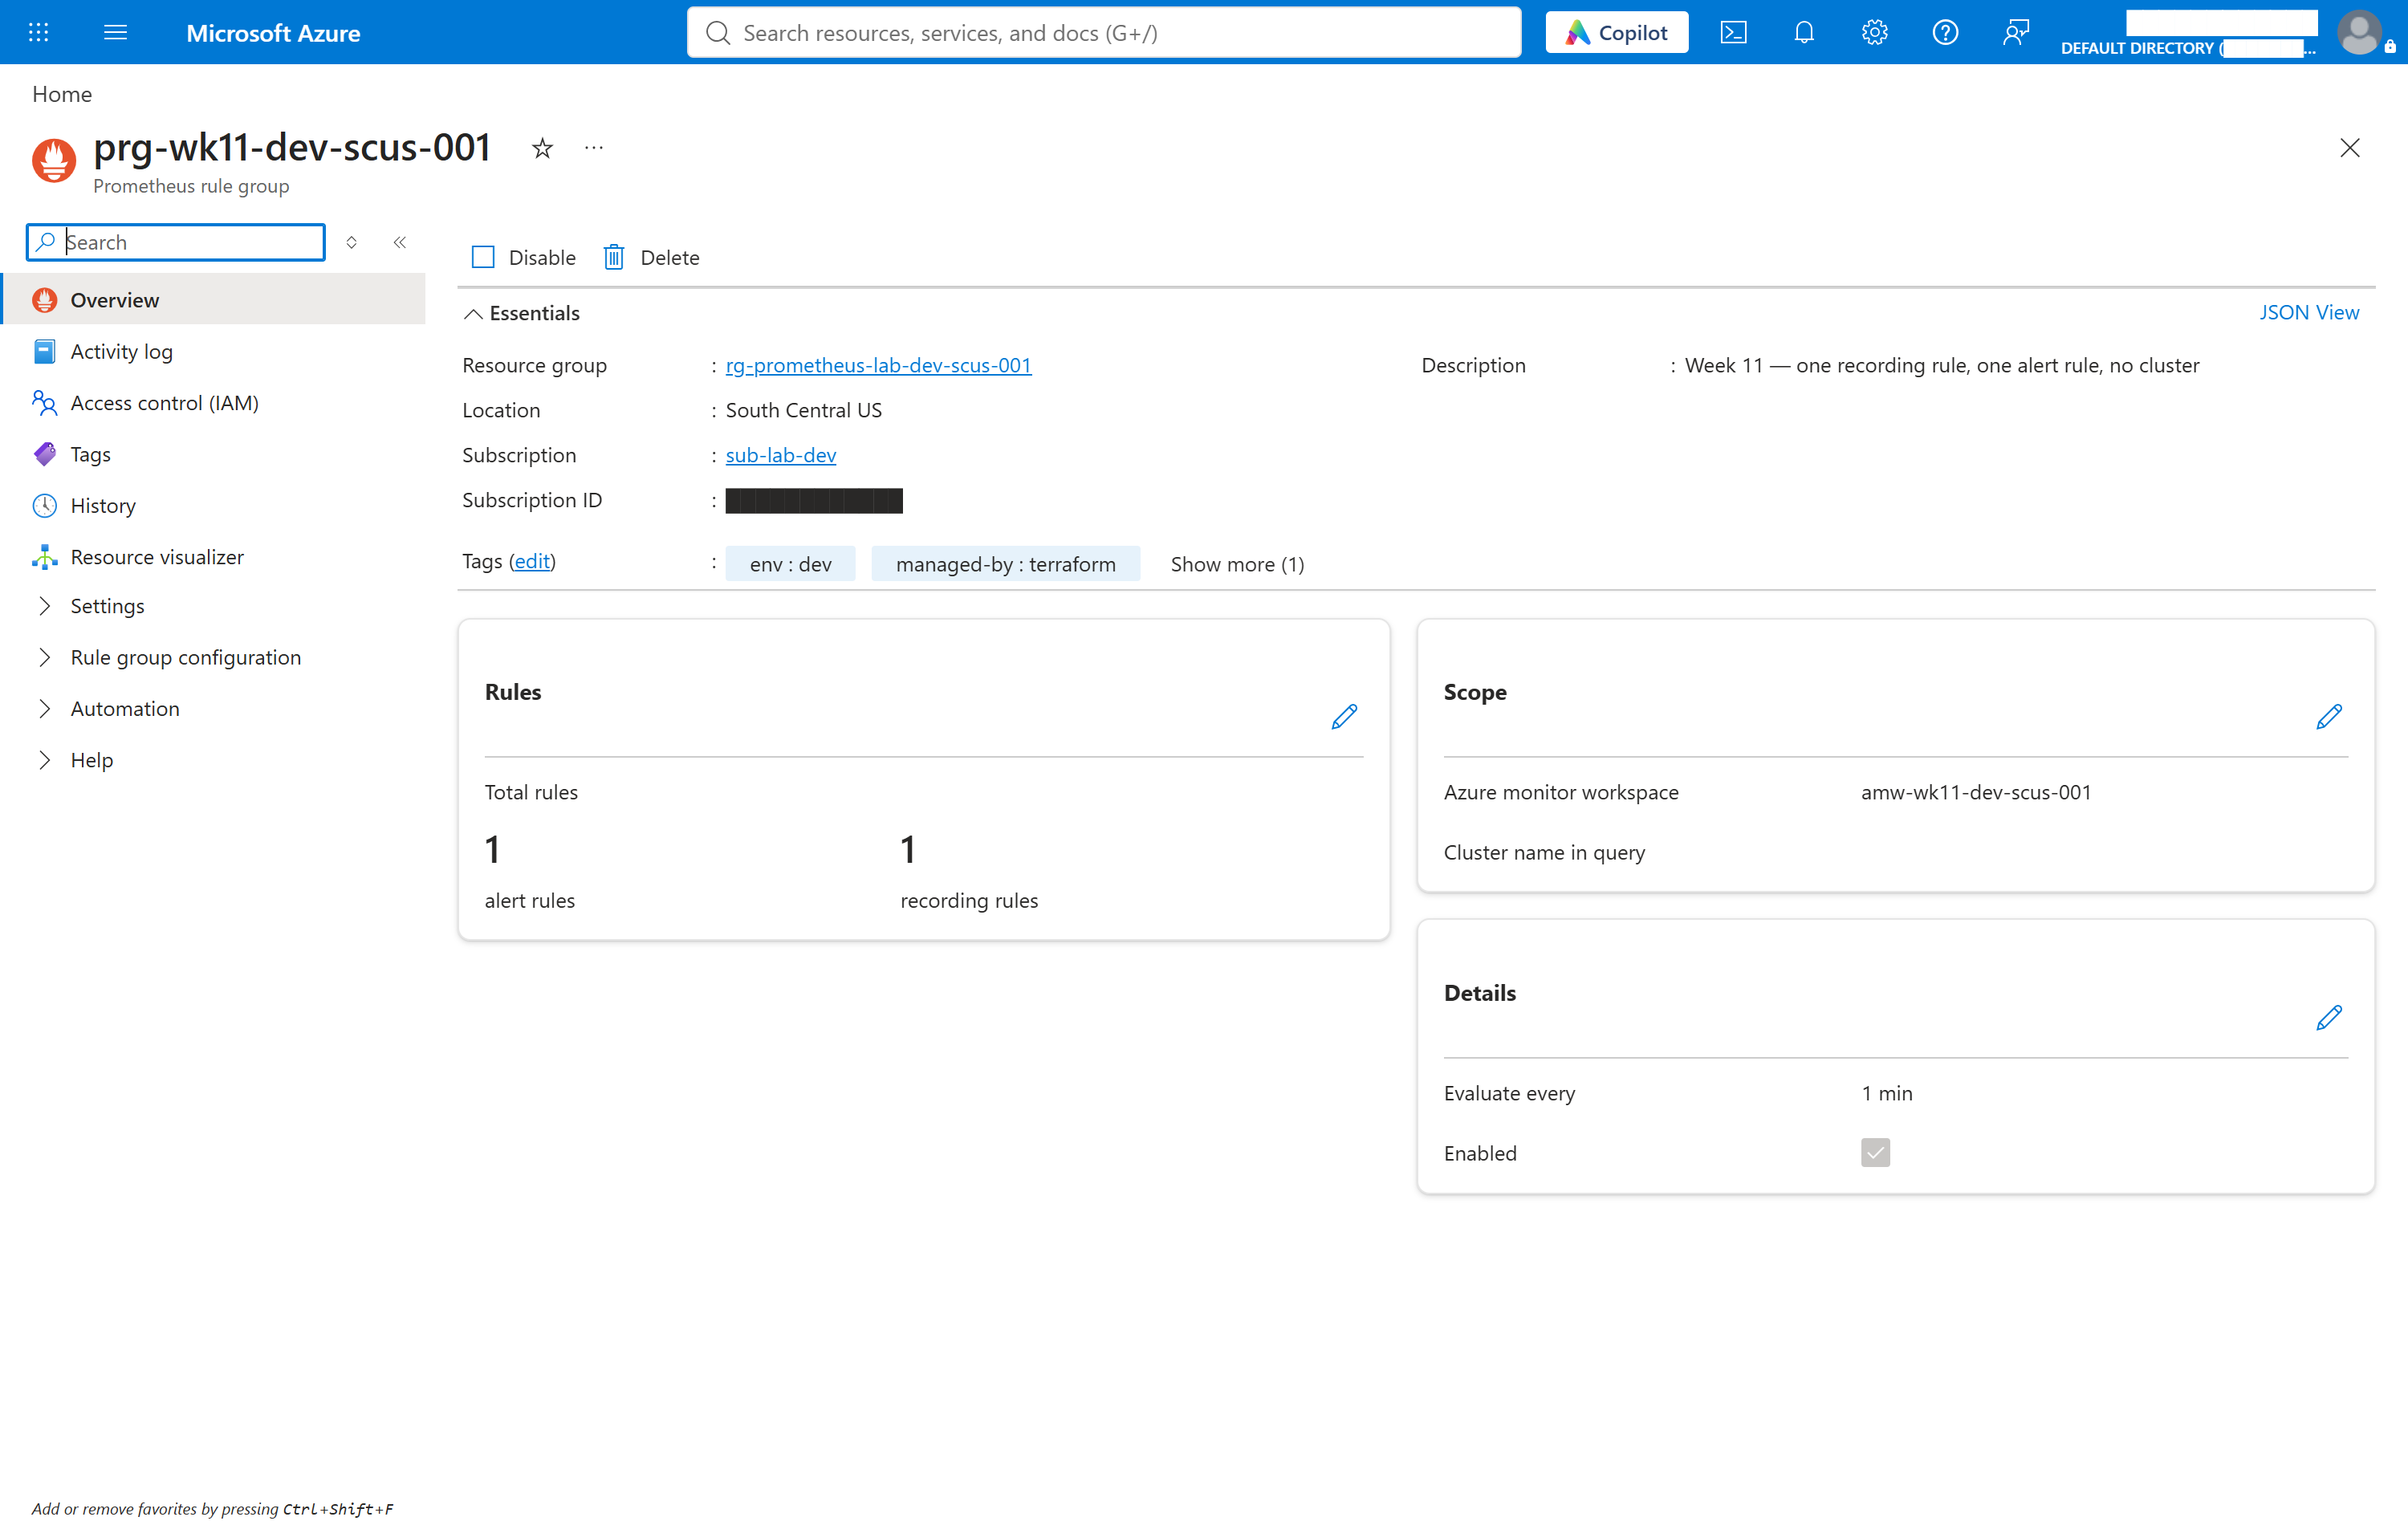
Security and Cost
No secret exists to leak. That is a design property, not a
discipline: the only credential-shaped thing in prometheus.yml is
a client id, which identifies an identity without granting anything.
The token comes from the instance metadata service at runtime and is never
written down. Microsoft's alternative Entra ID path would have put a
client_secret in that file.
Least privilege is enforced by scope. Monitoring Metrics Publisher sits on the data collection rule — not the workspace, not the subscription — and the validation asserts the subscription-scope count is zero rather than merely checking the grant exists. No inbound port is open at all, not even SSH; the public IP exists only because Azure's default outbound access is retired. Workspace data is encrypted at rest with a Microsoft-managed key.
What it cost, and the part that surprised me. By the last
query before teardown, Prometheus had shipped 796,849 samples
— read from prometheus_remote_storage_samples_total, not
estimated. (The counter reads 780,487 in the evidence figure above, captured
about an hour earlier; it is a counter, so it only climbs.) At
Azure's published $0.16 per 10M samples ingested, that is about
$0.013. One and a third cents.
The two machines that produced and displayed those samples bill at $0.1784/hour combined — the VM at $0.0962 and Grafana at $0.0411 per node-hour across two nodes. So the metrics pipeline, the entire subject of this week, cost roughly one percent of the compute standing around it. The expensive part of observability here was not the observability.
The honest caveat: this is one Prometheus scraping itself every 30 seconds. A real fleet multiplies the sample count without multiplying the VM count, and the ratio moves. The transferable lesson is to measure where the money actually is before optimising — not that ingestion is free.
All rates above were read from the Azure retail price API for
southcentralus on 28 October 2026, not from a pricing page. The
measured total is not in yet: Azure posts usage on a delay,
teardown happened the same day, and a number invented before the bill arrives
is not a measurement. It will be added here once the charges land —
including whether Grafana's 30-day free trial, which is one instance per
subscription, applied.
One control that exists for Log Analytics is unavailable here: Microsoft states that quota limits such as a daily cap or configurable retention cannot be used on an Azure Monitor workspace. Retention is 18 months, and that is not a dial.
Troubleshooting and Lessons
Problem: HTTP 403 for half an hour after a clean apply.
Root cause: the Monitoring Metrics Publisher grant had not propagated.
Microsoft documents this precisely — "It takes about 30 minutes for
the assignment of the role to take effect. During this time, you may see an
HTTP 403 error in the Prometheus log." That is roughly six times longer
than the equivalent grant took in week 08.
Resolution: wait, and make the validation poll rather than ask
once.
Lesson learned: a check that cannot distinguish wrong from not
yet teaches the wrong lesson. The apply finishes long before the pipeline
works, and in between, an empty query is indistinguishable from a broken
one.
Problem: unsupported protocol scheme "", hours after
Terraform reported success.
Root cause: the ingestion host was read from the data collection
rule, where that attribute is empty for a workspace-managed rule,
instead of from the endpoint.
Resolution: read it from the endpoint, and add the check
block shown above.
Lesson learned: an attribute existing on a data source does not mean it is
populated for your resource. Where a value is composed from several lookups,
assert the shape of the result — four lines moved a runtime failure to
plan time.
Problem: cloud-init failed to download Prometheus.
Root cause: it ran before the VM had outbound connectivity, failing
after 132 seconds against github.com. The network came up shortly
after and worked fine.
Resolution: a wait-for-egress probe loop ahead of the download, plus
curl --retry on top.
Lesson learned: runcmd running "late in boot" is not a promise of
connectivity, and one successful probe does not promise the next request
succeeds. Wait and retry.
Problem: Grafana deployed, and nobody could open it.
Root cause: the Azure RBAC that creates the resource and the
Grafana RBAC that authorises a login are separate systems. Listing
role assignments on the healthy instance returned nothing.
Resolution: an explicit Grafana Admin assignment on the
instance for the deploying principal.
Lesson learned: easy to miss precisely because every other resource in this lab
is usable by whoever deployed it. A resource with its own internal
authorisation model needs that model configured too.
Cleanup and Key Takeaways
# teardown is the only irreversible step - check the figures first
python scripts/check_figures_before_destroy.py week-11-managed-prometheus
./scripts/cleanup.sh
Three things bill by the hour and none stops on its own: the Grafana
instance, the VM, and the public IP. cleanup.sh does not trust the
destroy's exit code — it counts what survives by resource type and prints
the number, because an earlier week in this lab had a destroy report success
while a firewall kept billing. Observed: 16 resources destroyed,
every count zero, including orphaned role assignments. Grafana alone took
10m12s to delete; that is normal, not a hang. Nothing shared was touched.
What this week taught:
- Managed Prometheus is not a Kubernetes feature. The
add-on scrapes clusters, but
remote_writeaccepts anything that can speak it — including one VM with no cluster in sight, and a rule group withclusterNameempty. - An Azure Monitor workspace is not a Log Analytics workspace. Different ARM type, different query language, different bill, and none of the retention or daily-cap controls carry over.
- Grant on the rule, not the workspace. The data collection rule is what accepts the write, so it is the narrowest scope that works — and "narrowest that works" is testable, which is why the validation asserts the subscription-scope count is zero.
- An empty string is a valid string. The most expensive
defect here applied cleanly, booted cleanly, and failed hours later. A
checkblock costs four lines and moves that to plan time. - Creating a resource is not being granted access to it. Managed Grafana has its own authorisation model, and deploying it grants the deployer nothing inside it.
What production does differently: it scrapes a workload rather than itself, runs collection with redundancy instead of one VM, routes egress through a NAT gateway or private endpoint, and points its alert rules at an action group that actually notifies someone. This week's action group has no receiver — it proves a Terraform-defined rule becomes a rule Azure evaluates, and deliberately does not claim a notification was delivered.
References
- Connect self-managed Prometheus to Azure Monitor managed service for Prometheus
- Azure Monitor workspace overview
- Prometheus rule groups in Azure Monitor
- Share access to Azure Managed Grafana
- Prometheus configuration reference
-
azurerm_monitor_alert_prometheus_rule_group - Terraform
checkblocks - Source for this week · LAB.md runbook
Comments