📋 In This Post
Why — The Problem This Solves
An event bus is the easiest thing in AWS to deploy and one of the hardest to interrogate.
You call PutEvents. It returns HTTP 200 and an event id. Your code moves on. That response means the bus accepted your event — and nothing more. It does not mean anything was listening, it does not mean anything was delivered, and it does not mean anything ever will be.
There is no compile step for an event. No contract, no type check, no error when a producer renames a field. A consumer subscribes to a detail-type it types by hand, and a transposed letter costs nothing at deploy time and nothing at publish time. It costs you at 3am, when someone asks why the orders stopped arriving.
The three questions nobody can answer
When an event-driven system misbehaves, the questions are always the same, and until recently AWS could not answer the first one at all:
- Who published this? —
PutEventsis a data-plane operation, and CloudTrail does not log data events by default. Until 4 May 2026 there was no way to log it at all. - What did it look like? — the payload is gone once it is delivered, unless something kept a copy.
- Can I get it back? — only if you set that up in advance, before you needed it.
This week builds the four mechanisms that answer those questions on one bus, then tries to break each one. Every answer turns out to be real and narrower than it sounds.
What You Need to Know — Skills & Tools
Comfortable with Terraform. No prior EventBridge experience needed; the vocabulary is five words.
- Event bus — a router. Publishers send to it, rules decide where things go. The
defaultbus already carries every AWS service event in your account, which is why this build makes its own. - Rule and event pattern — a rule holds a pattern, and the pattern is a filter, not a query. It matches values and prefixes. It cannot express "where this field is absent" the way SQL can.
- Target — where a matched event is delivered. A Lambda, a queue, another bus.
- Archive and replay — keep a copy of everything published, and re-deliver a time window of it later.
- Schema registry — a catalogue of event shapes. Discovery fills it in by watching real traffic.
One number worth carrying into every design decision: EventBridge bills in 64 KB chunks. A 256 KB event is billed as four events, everywhere — ingestion, cross-account delivery, replay.
Architecture — How It Fits Together
One bus, two subscribers, and three mechanisms watching it.
Why a custom bus and not default
The default bus already carries every AWS service event in the account. A discoverer pointed at it would infer schemas for unrelated traffic, and an archive would store all of it at $0.023/GB-month. A custom bus keeps the experiment’s blast radius equal to the experiment.
How We Built It — Step by Step
Step 1 — Decide what "accountable" means before building it
Four questions, four mechanisms, each answering exactly one:
| Question | Mechanism |
|---|---|
| Can I get the event back? | Archive + replay |
| What did it actually look like? | Schema registry + discovery |
| Who published it? | CloudTrail data events |
| What failed to deliver? | Dead-letter queue |
Step 2 — The trail, and the one line that decides the bill
PutEvents is a data-plane operation, so it needs an advanced event selector, and data events are charged. The third field selector is the one that matters:
advanced_event_selector {
  field_selector { field = "eventCategory"  equals = ["Data"] }
  field_selector { field = "resources.type" equals = ["AWS::Events::EventBus"] }

  # Scoped to ONE bus. Without this, every PutEvents in the
  # account is logged and billed -- including other projects'.
  field_selector { field = "resources.ARN"  equals = [aws_cloudwatch_event_bus.this.arn] }
}
Step 3 — Build the detection AWS does not give you
EventBridge publishes a MatchedEvents metric per rule. There is no metric anywhere for events that matched no rule at all — the thing you actually want to know. An unmatched event is not an error; it is a successful publish with no subscriber, and AWS has no opinion about it.
So the detection has to be built, and there is only one way to build it: a catch-all rule that matches everything, so every event is guaranteed to match at least one rule. Then the unmatched count is arithmetic:
unmatched = catch_all.MatchedEvents - orders.MatchedEventsThat is a CloudWatch metric-math alarm, not a Lambda. And it is not free. Every event now goes to a log group as well as wherever it was going, and you pay ingestion and storage for it. You buy the visibility with a second delivery. Anyone presenting the catch-all as a neat trick without saying that is selling you something.
Step 4 — Deploy it
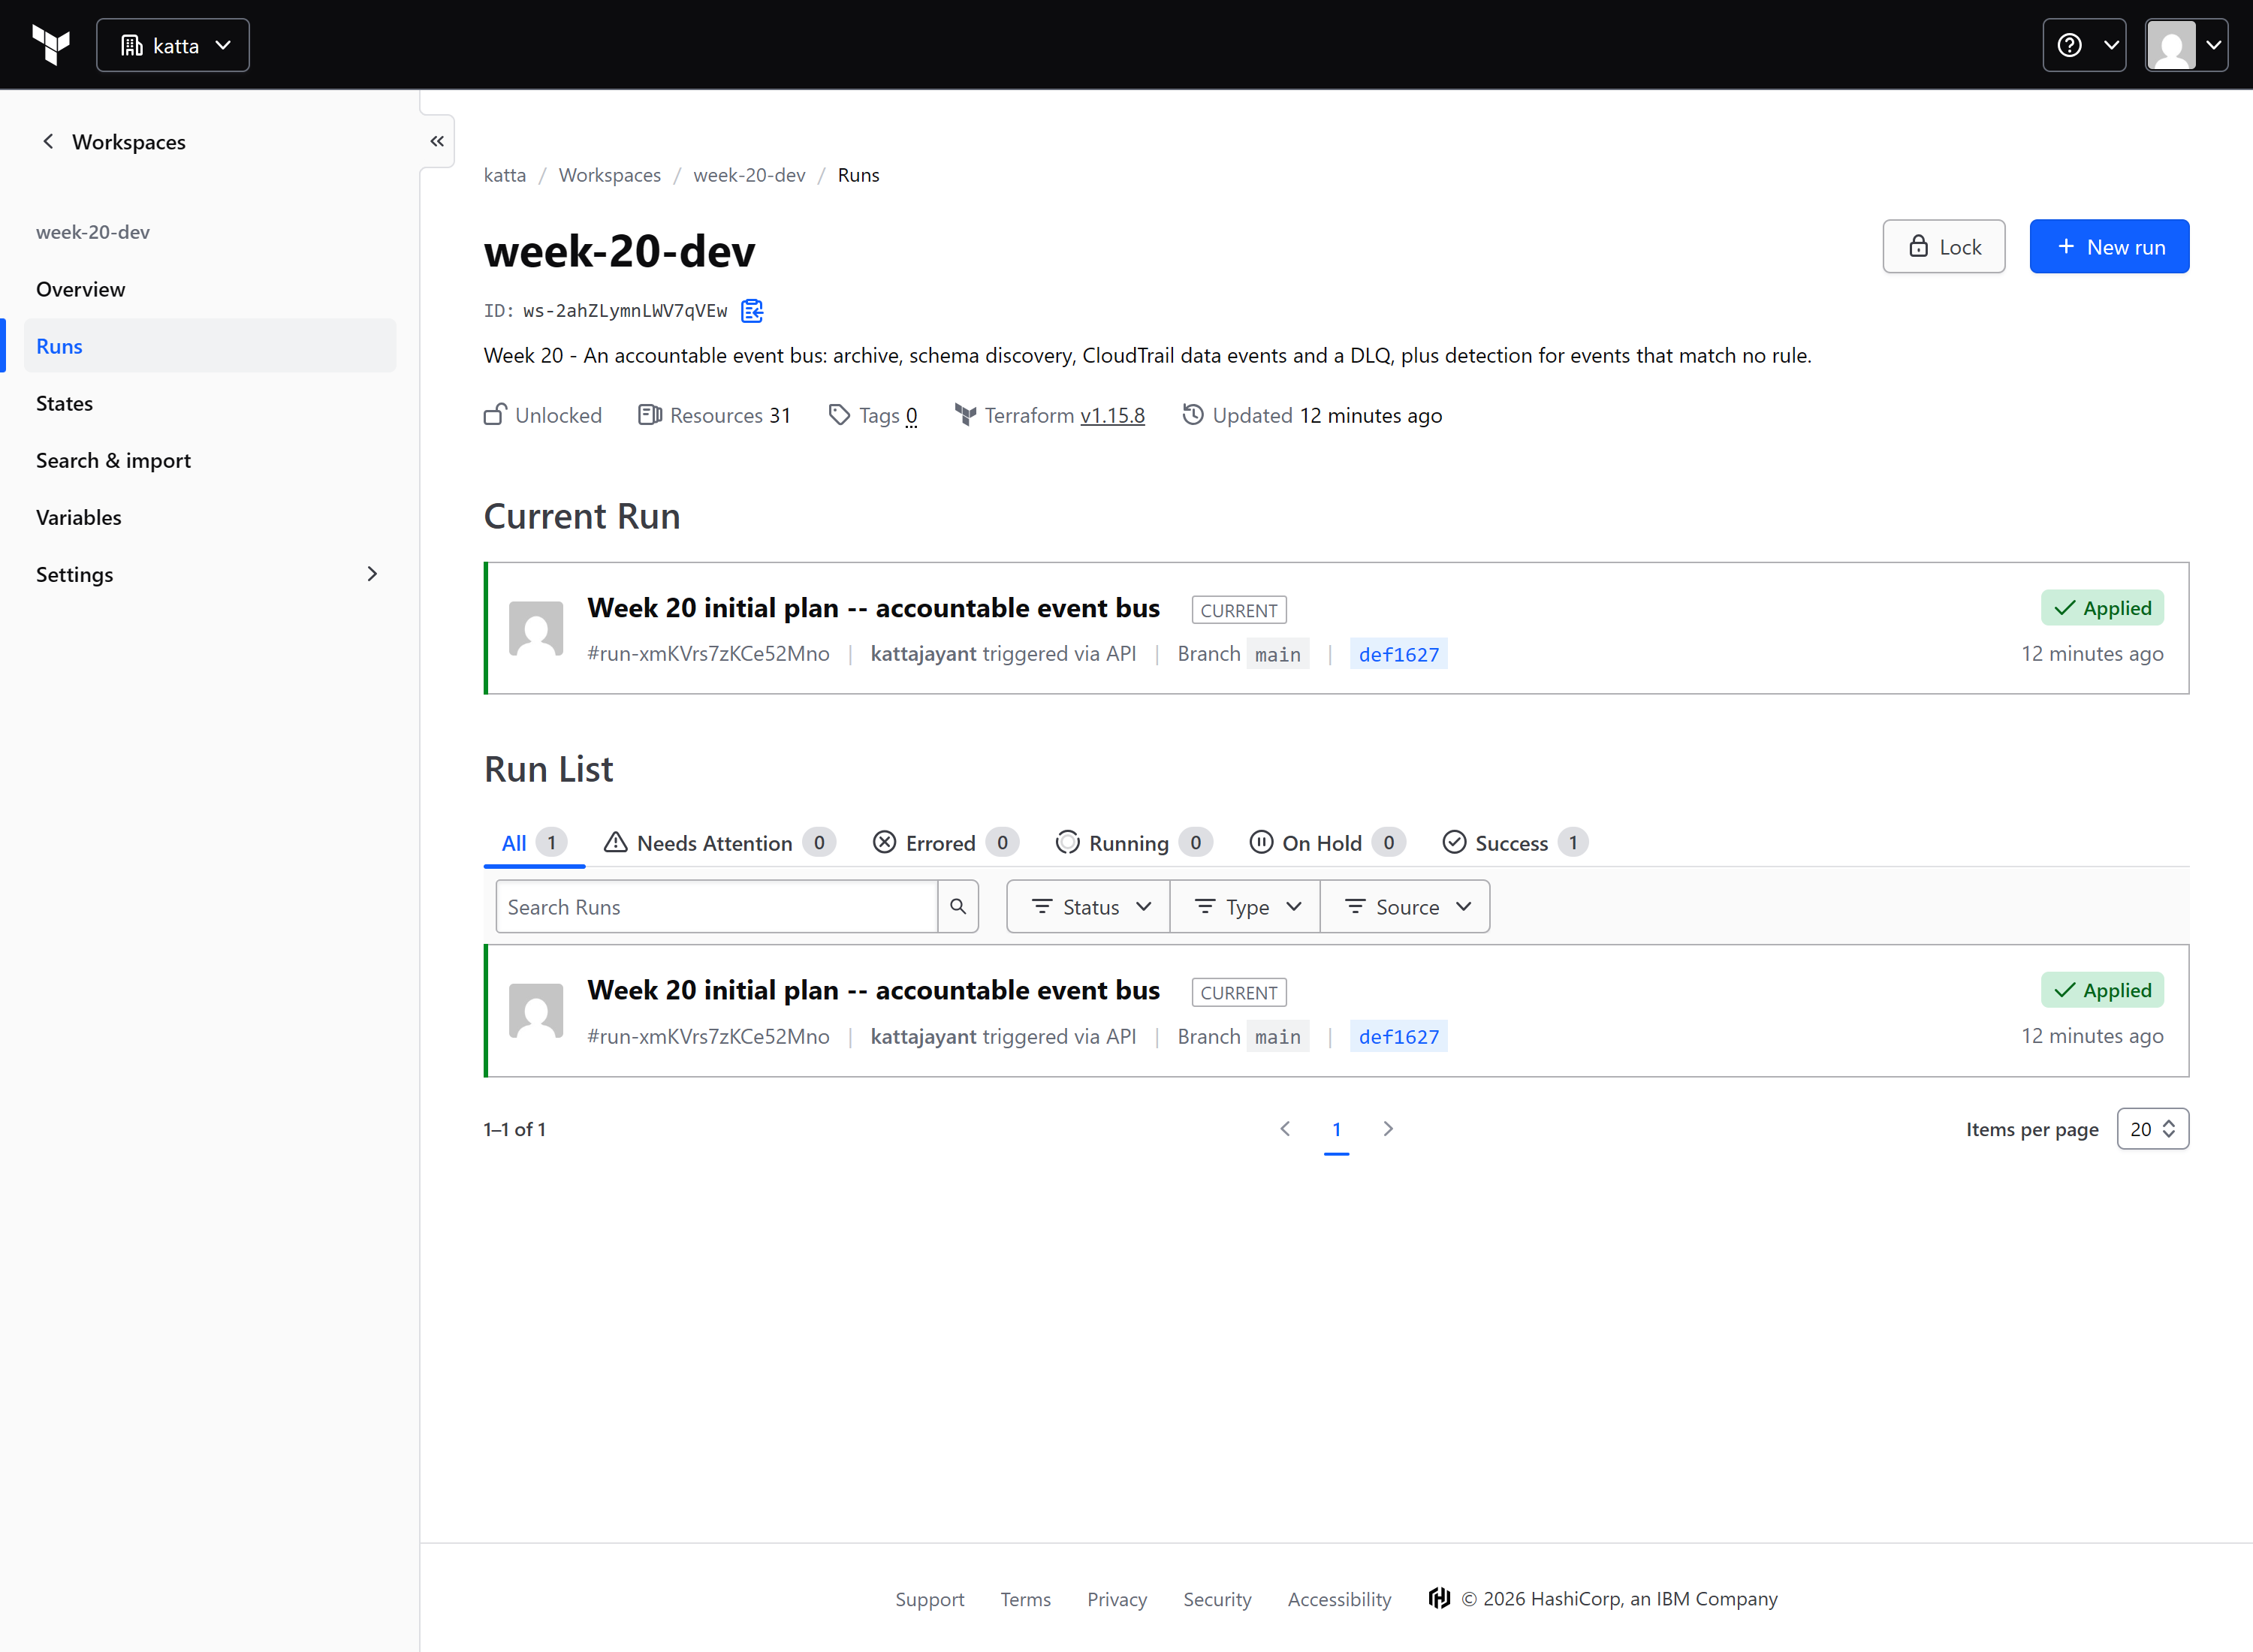
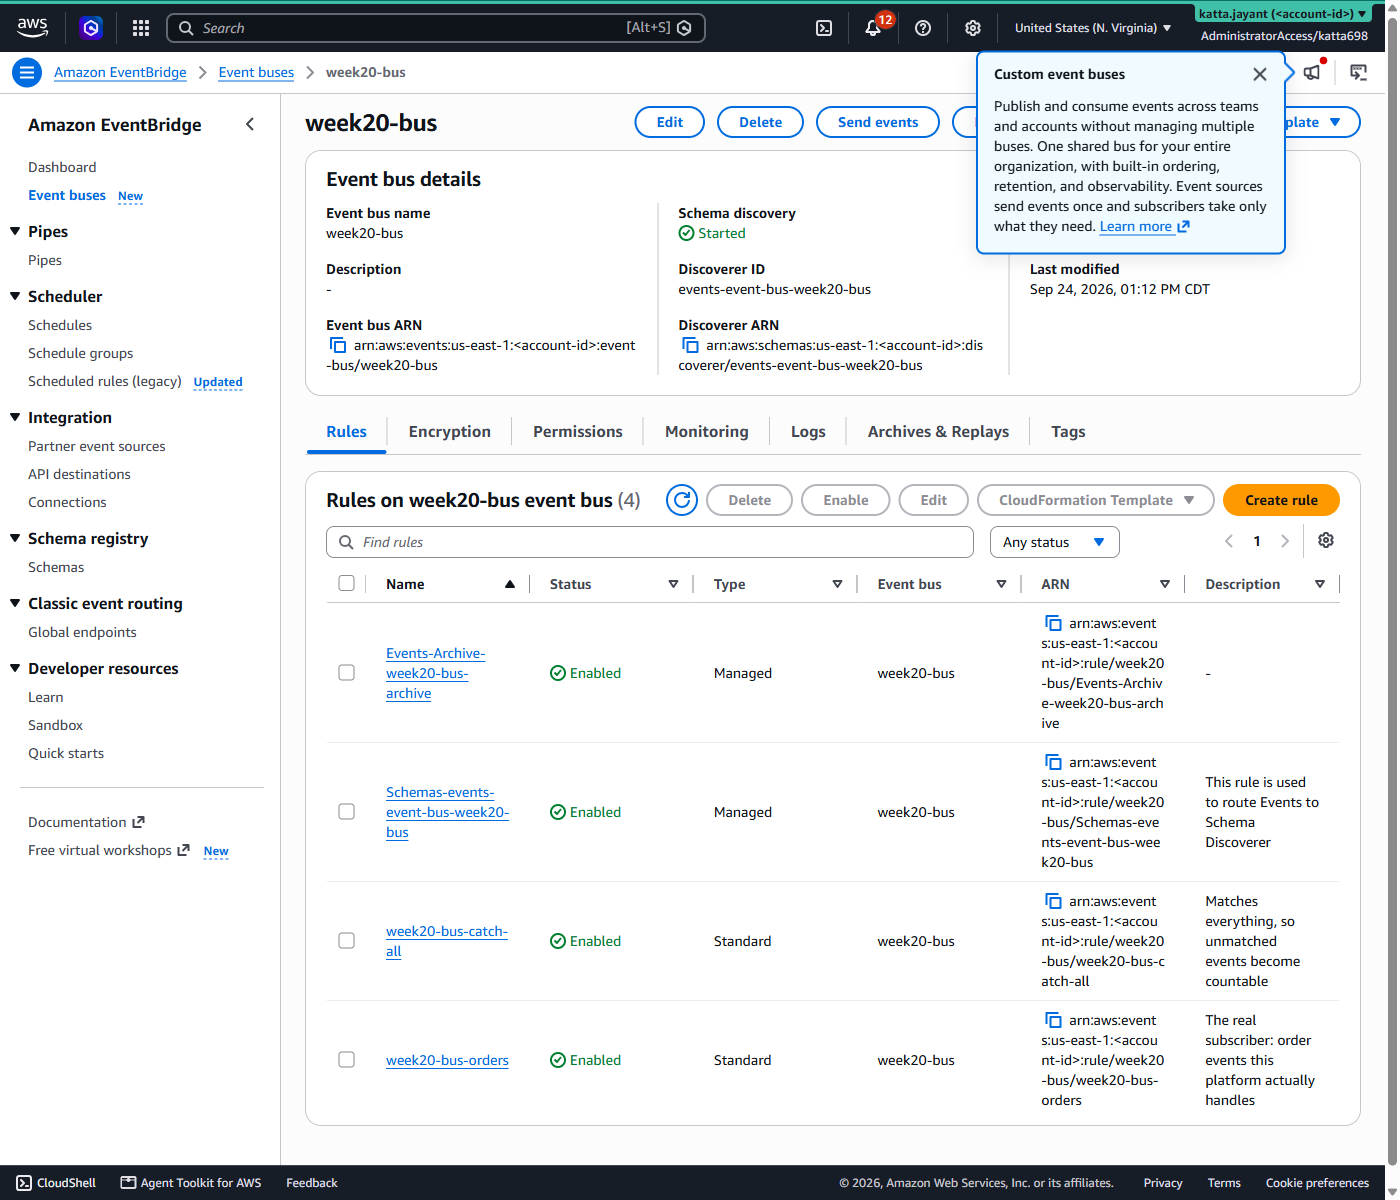
Step 5 — Who published it, and the half you do not get
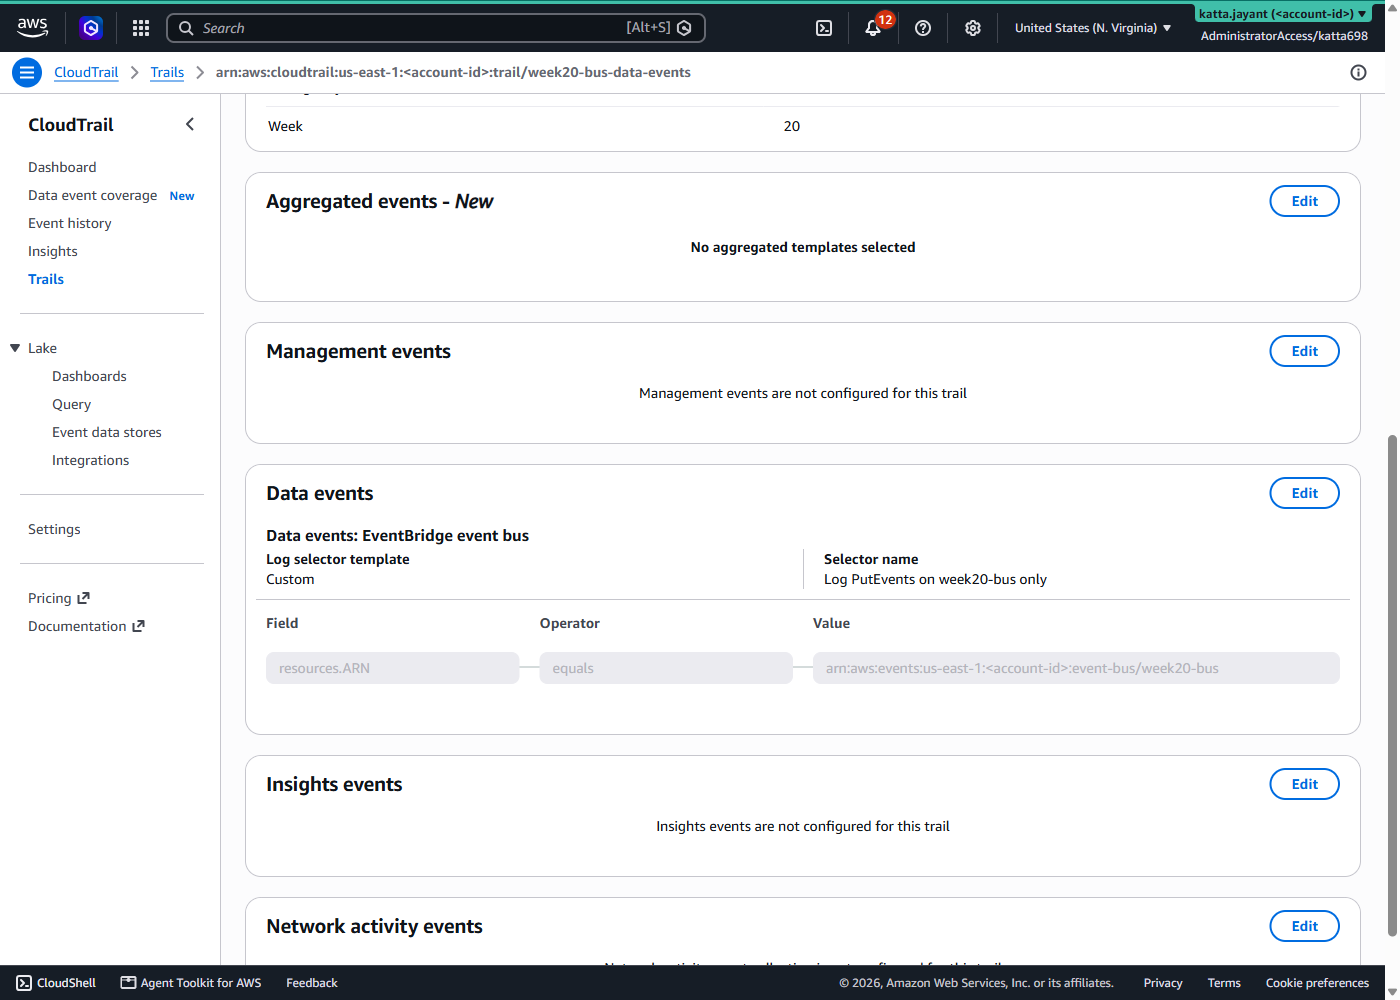
AWS::Events::EventBus, scoped by resources.ARN equals this one bus. This trail exists to log PutEvents and nothing else — and before 4 May 2026 it could not have been built at all.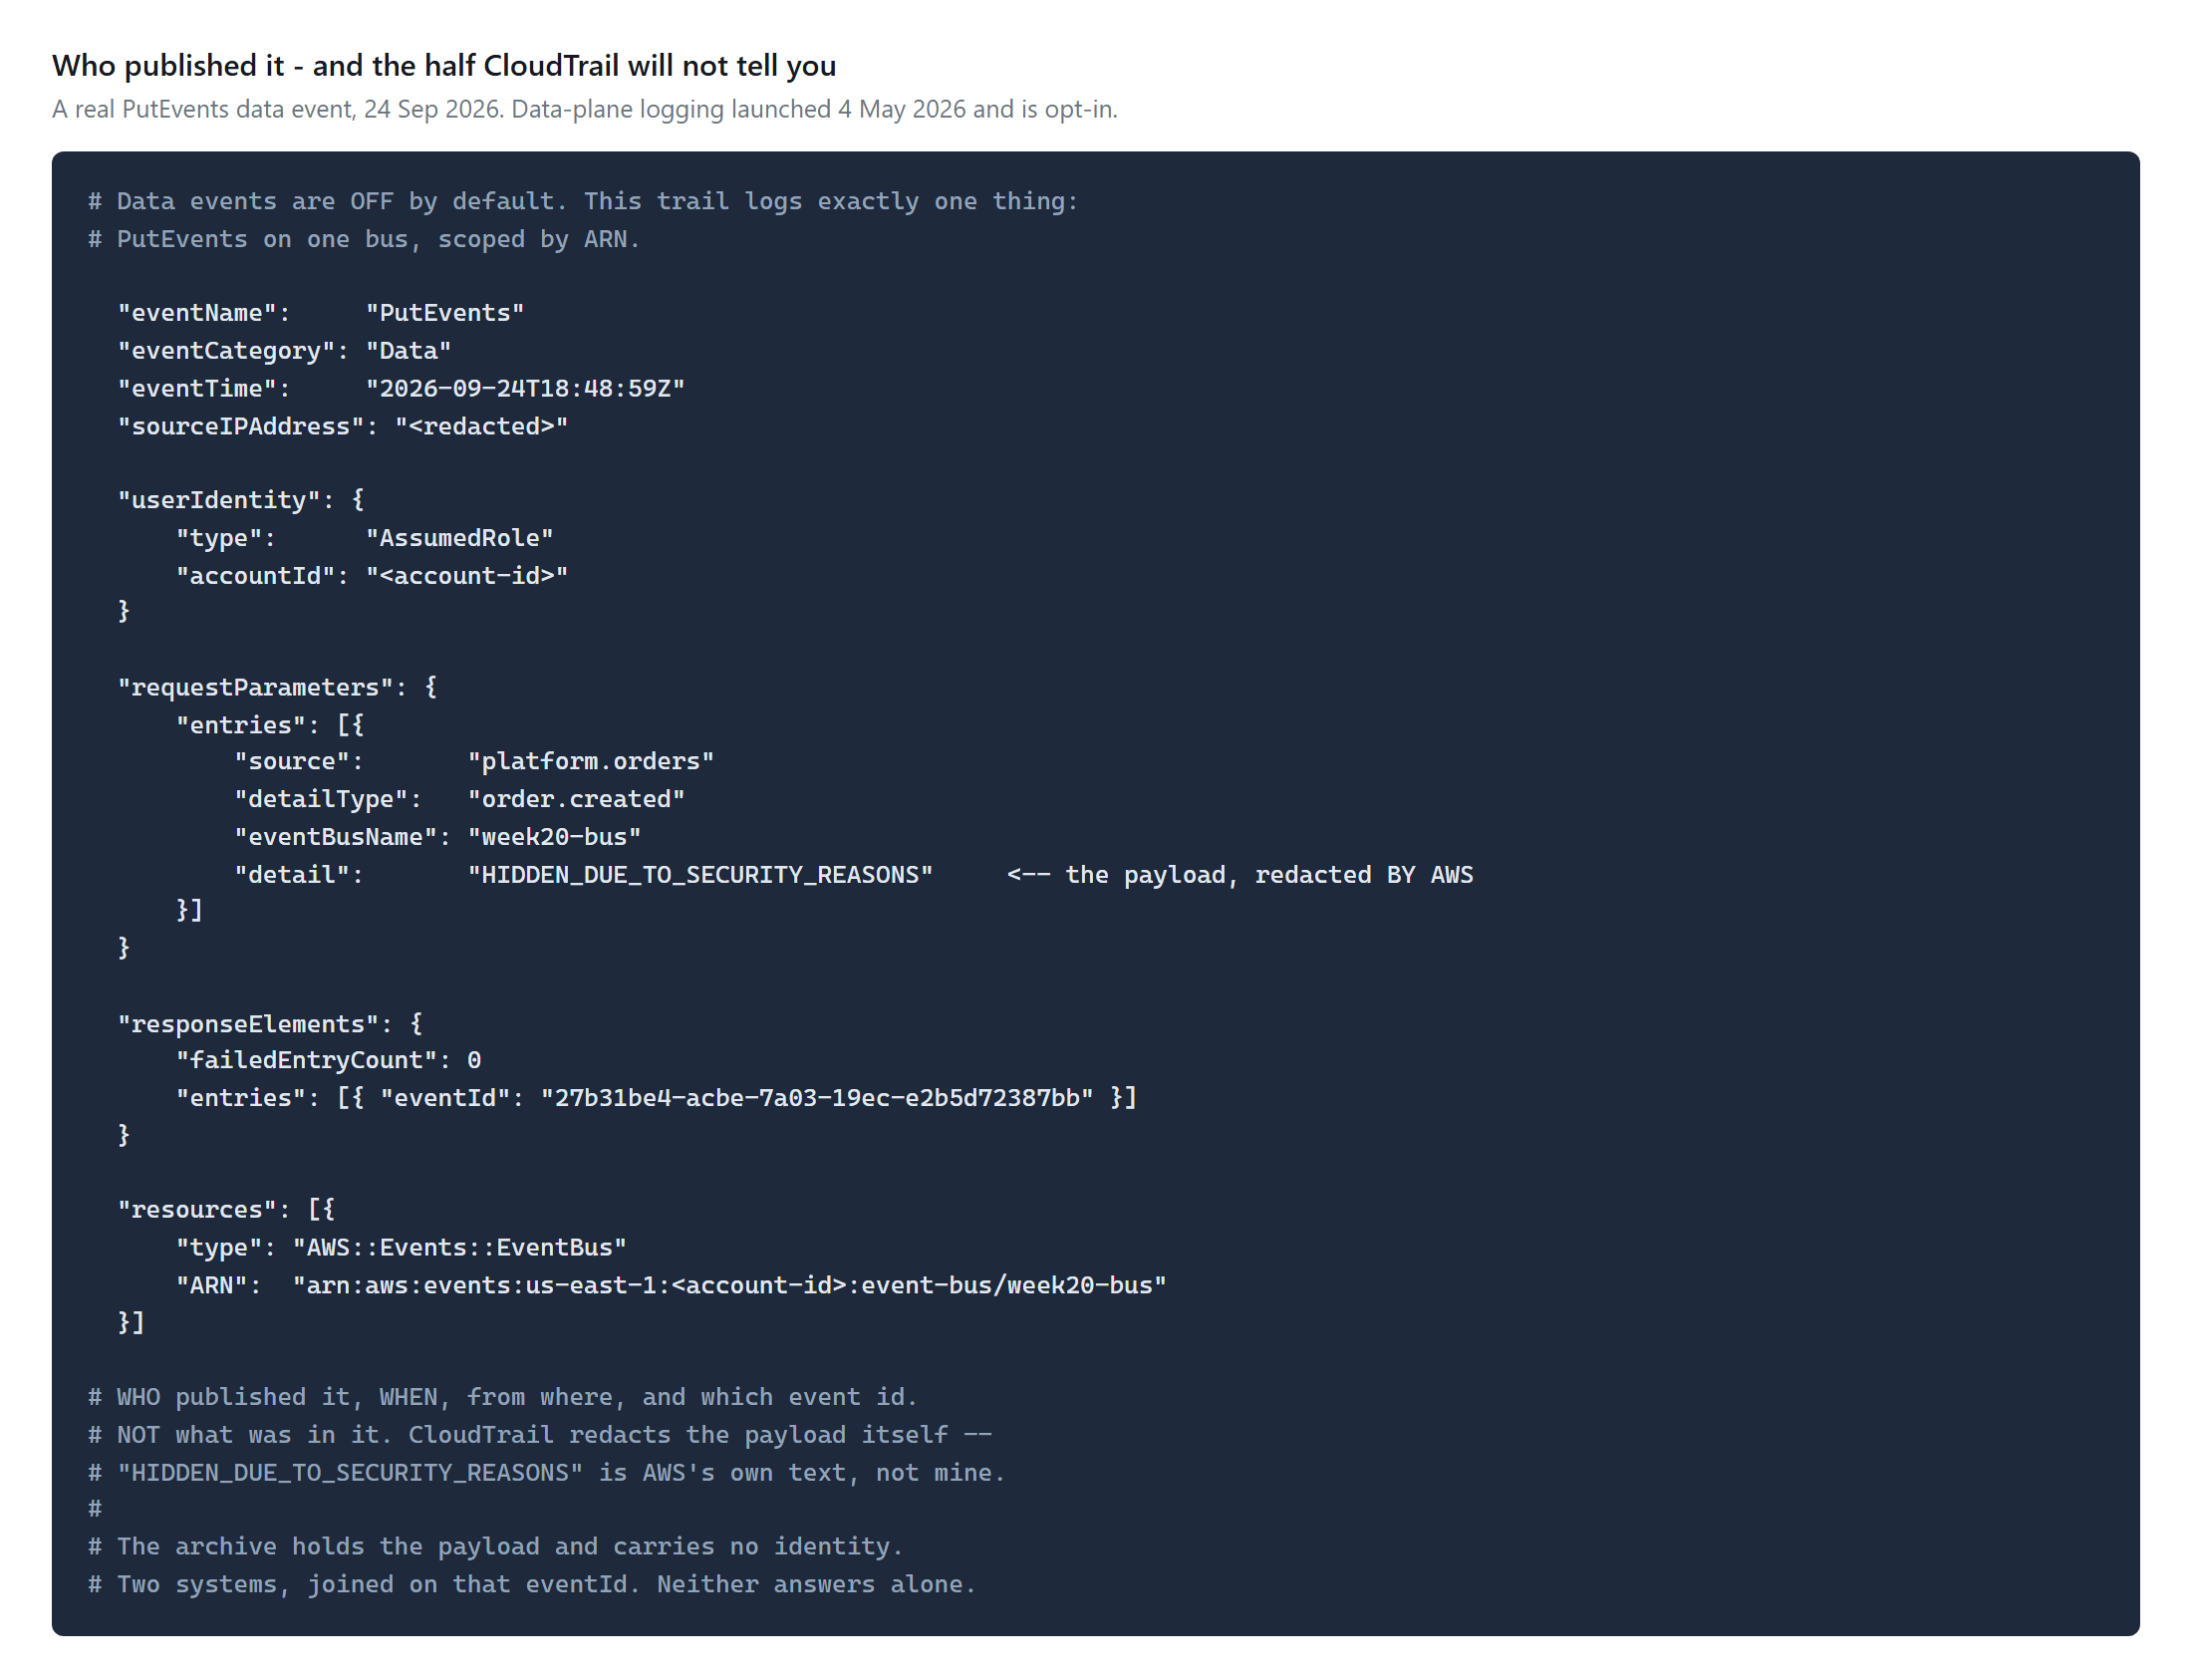
"detail": "HIDDEN_DUE_TO_SECURITY_REASONS" — AWS’s own words. CloudTrail tells you who and never what. The archive holds the payload and carries no identity. Two systems, joined on that event id, and neither answers alone.Verifying it actually works
The experiment is one transposed letter. Publish order.crated against a rule matching order.created:
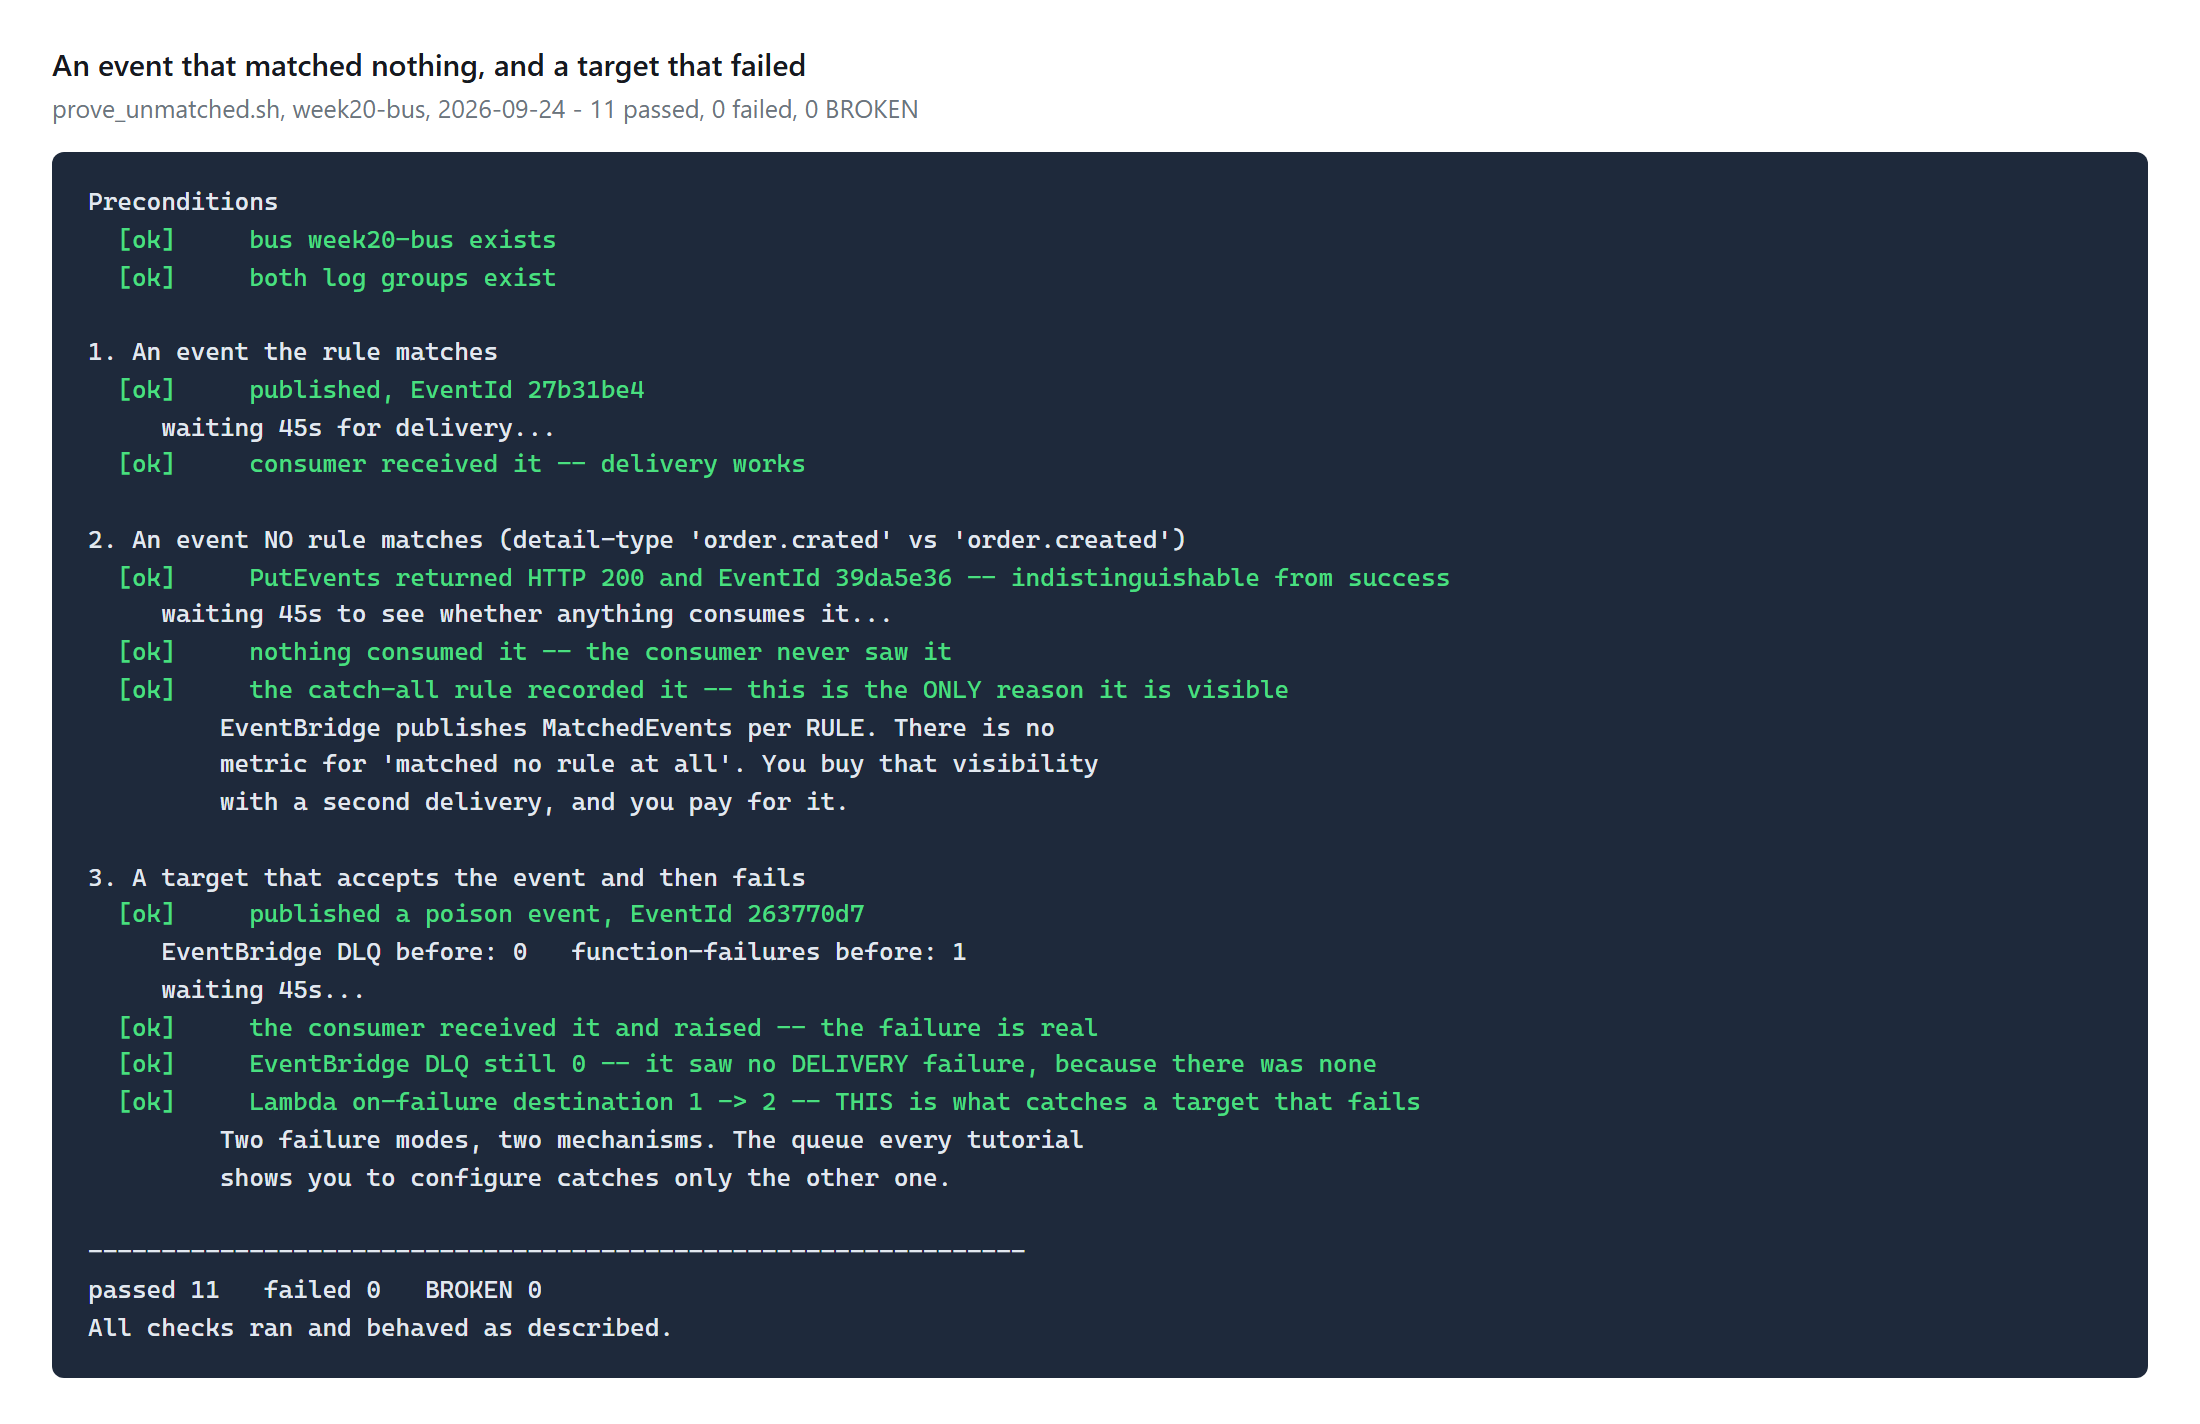
PutEvents returned 200 and an event id for an event the consumer never saw.The script reports three outcomes, not two. A check whose precondition did not hold is BROKEN, never a pass. Week 18 of this series published a test that scored two of four green against pods that never started, because the checks searched for a failure string and work that never happens produces no string. Here, "nothing arrived" only counts as a finding once "something can arrive" has been shown in the same run.
Challenges — What Actually Went Wrong
1. The registry wrote the typo down as a real schema
Schema discovery inferred three schemas from the traffic:
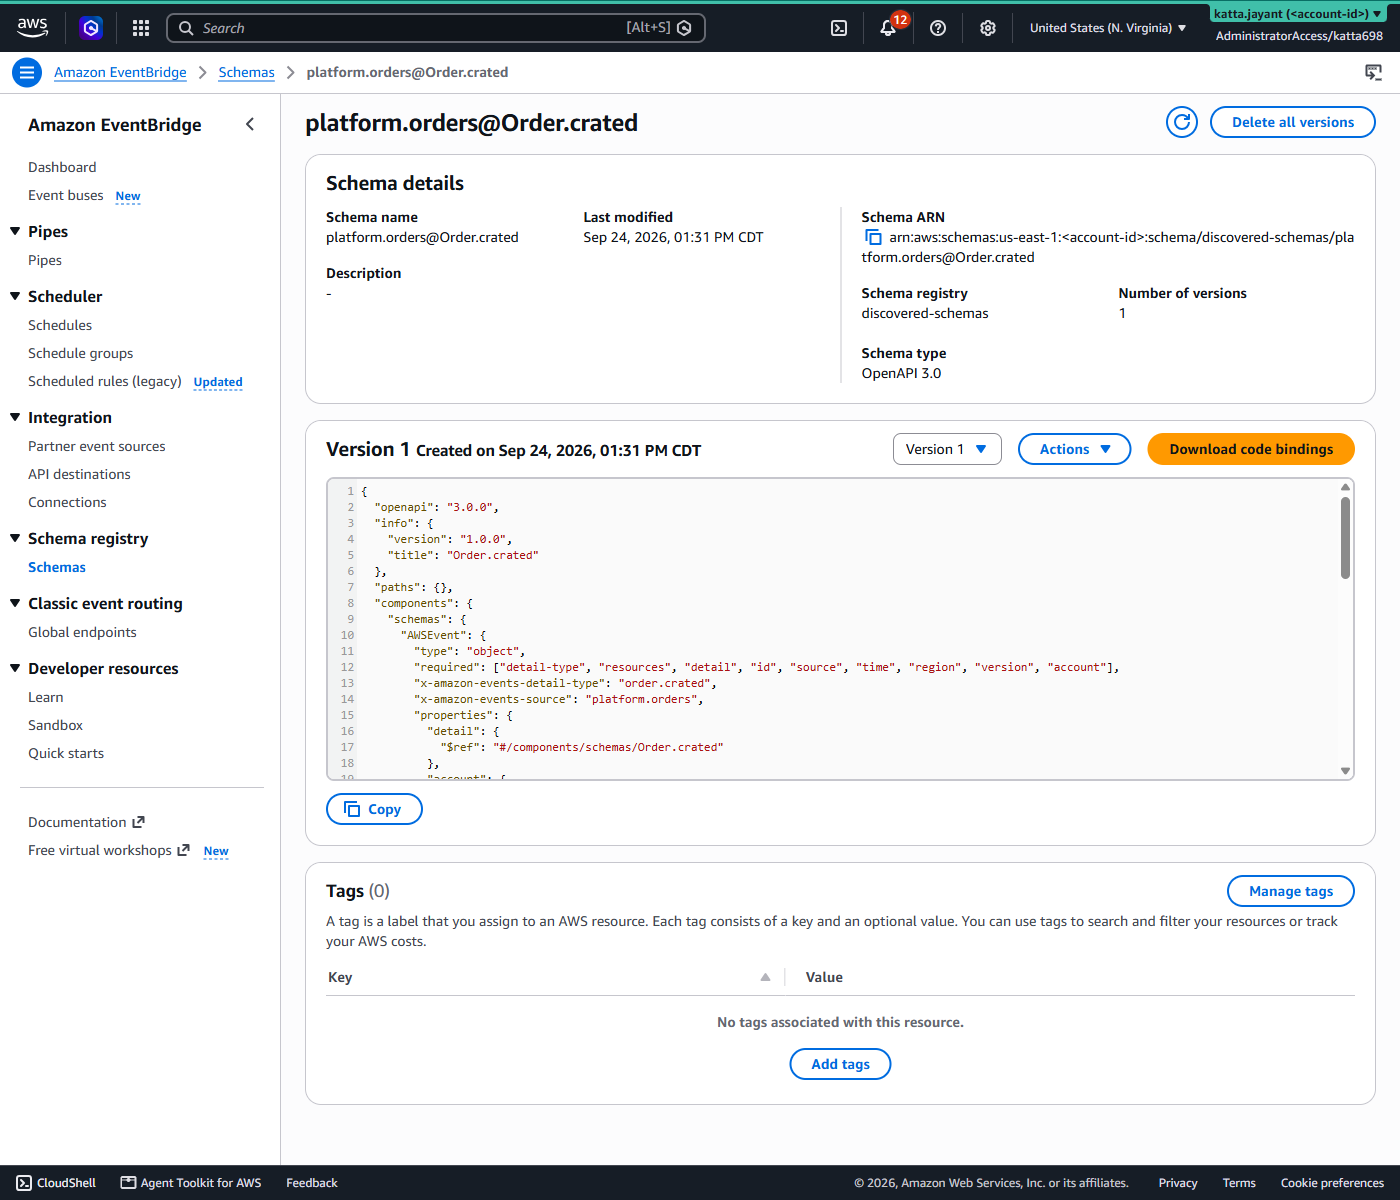
Order.crated is the typo. Published once, matched by nothing, consumed by nobody — and now carrying a full OpenAPI definition beside the real event.The discoverer did exactly its job, and that is the problem. A registry documents what producers actually send, and at the wire level there is no difference between a new event type and a bug. So the mistake does not merely escape detection — it gets written down as though it were intended, where the next engineer reads it as a contract.
And nothing rejected any of them. EventBridge accepted every event regardless of the registry’s contents. Discovery is not validation.
2. The dead-letter queue everyone configures catches the other failure
I attached a DLQ to the rule target, published an event the consumer fails on, and the queue stayed empty. My first instinct was that my test was broken. It was — but the empty queue was real:
| Metric | Value |
|---|---|
Lambda Invocations / Errors | 5 / 3 — the function definitely threw |
EventBridge FailedInvocations | no datapoints |
EventBridge InvocationsSentToDLQ | no datapoints |
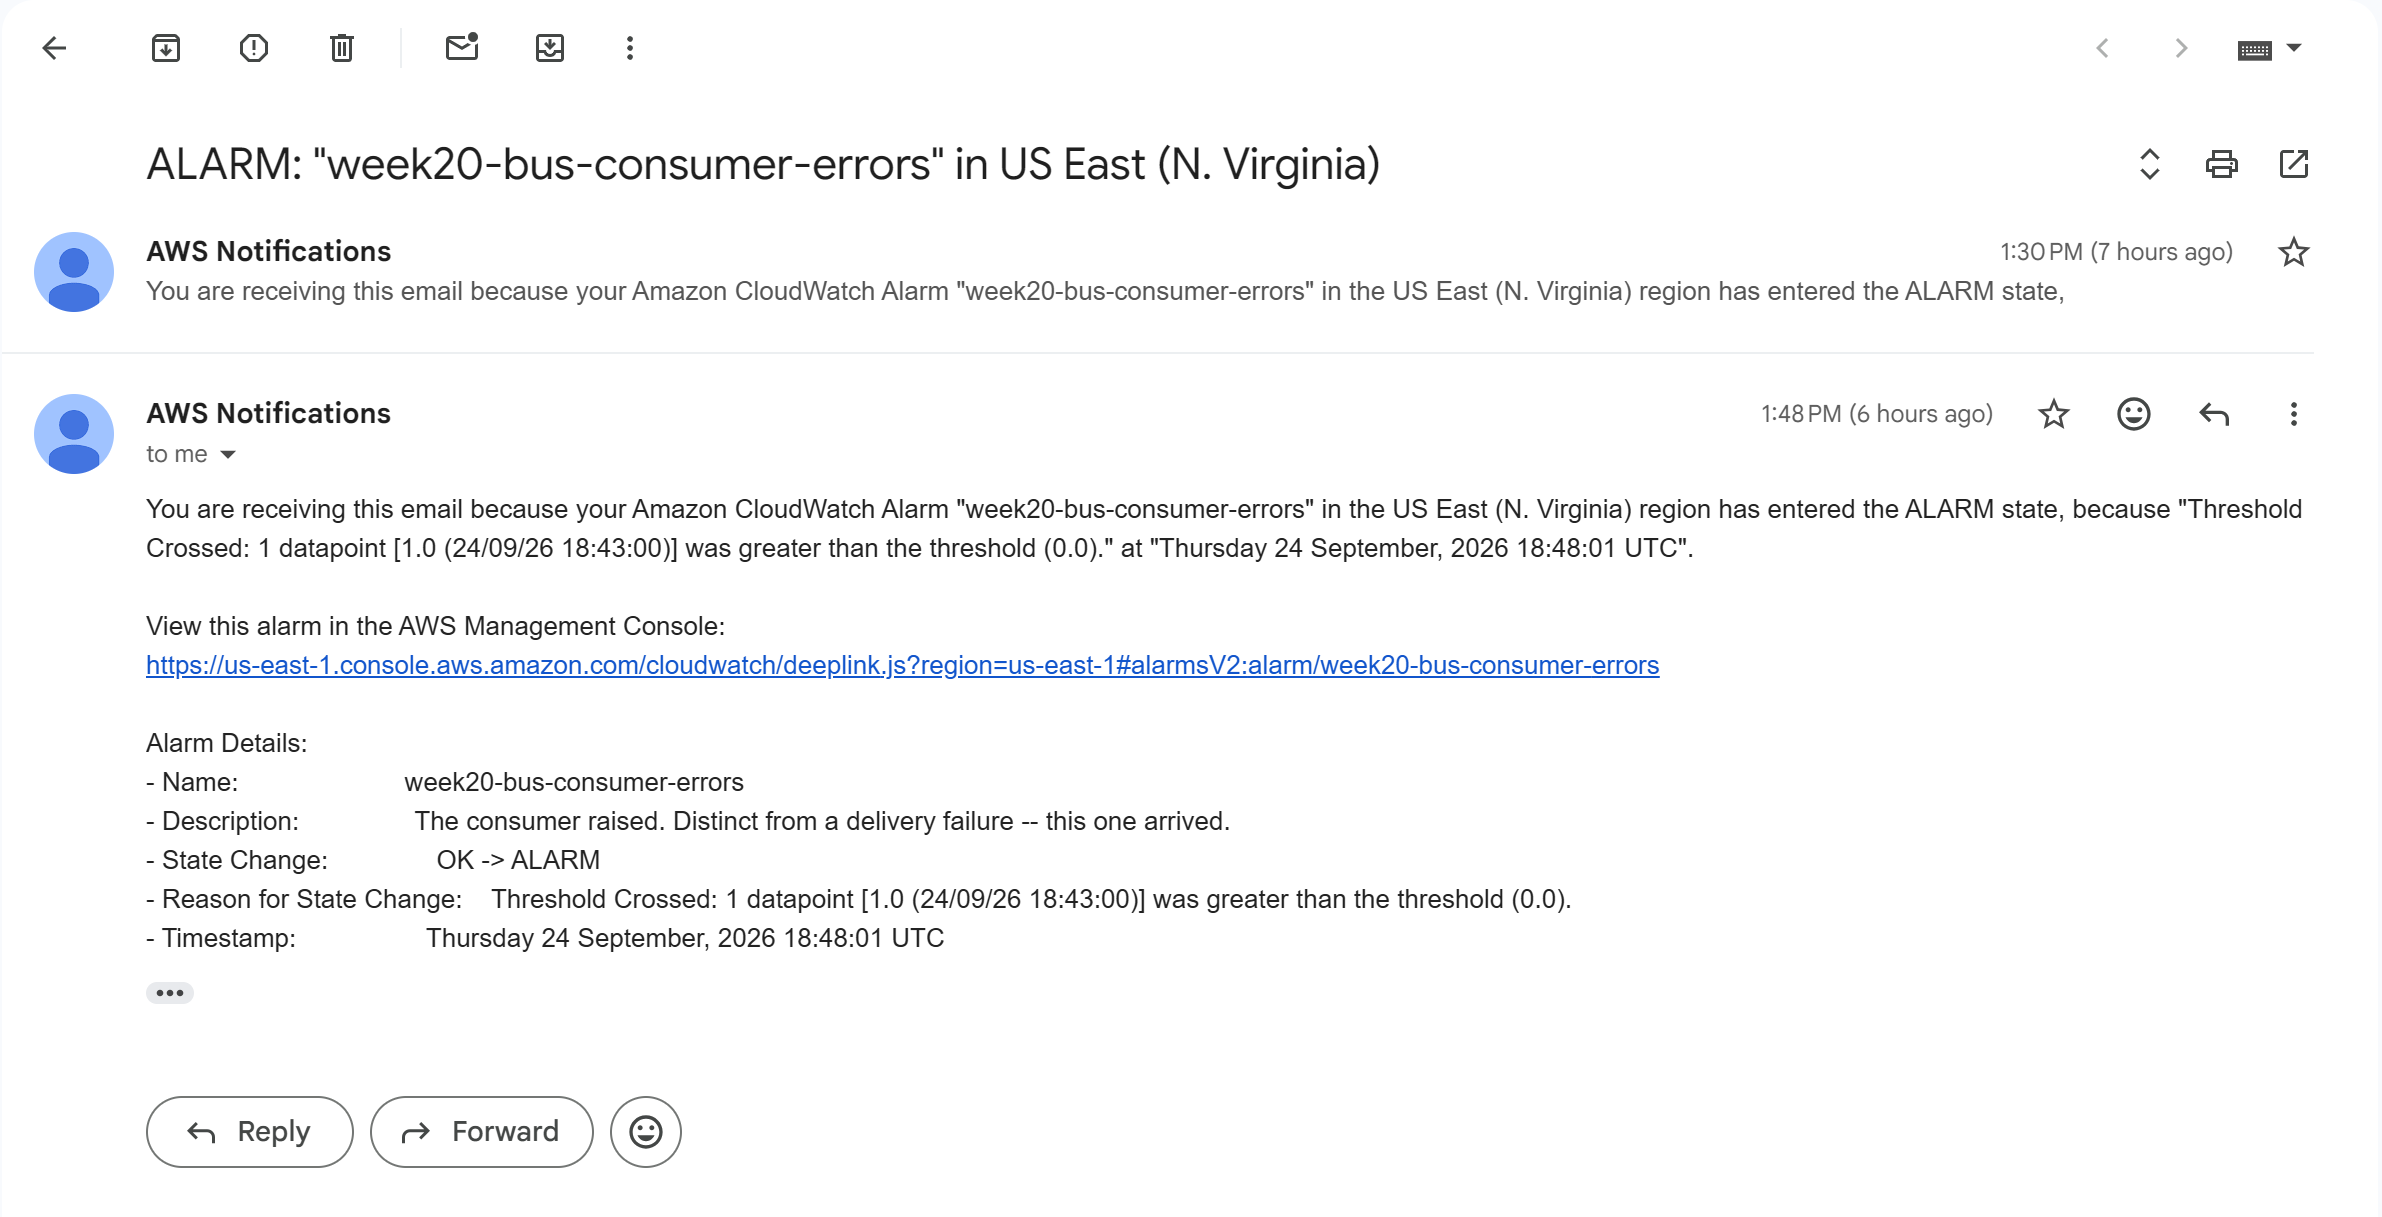
EventBridge invokes a Lambda target asynchronously. Its delivery succeeded the instant Lambda accepted the invocation. The function blowing up afterwards is not a delivery failure and is structurally invisible to it.
The EventBridge DLQ catches NO_PERMISSIONS, NO_RESOURCE, THROTTLING — "I could not hand this over." A target that accepts an event and then fails needs Lambda’s own on-failure destination: a different mechanism, configured in a different place, that the walkthroughs do not mention. Two failure modes, two queues, and the one everybody configures covers only one of them.
3. Replay is not a time machine
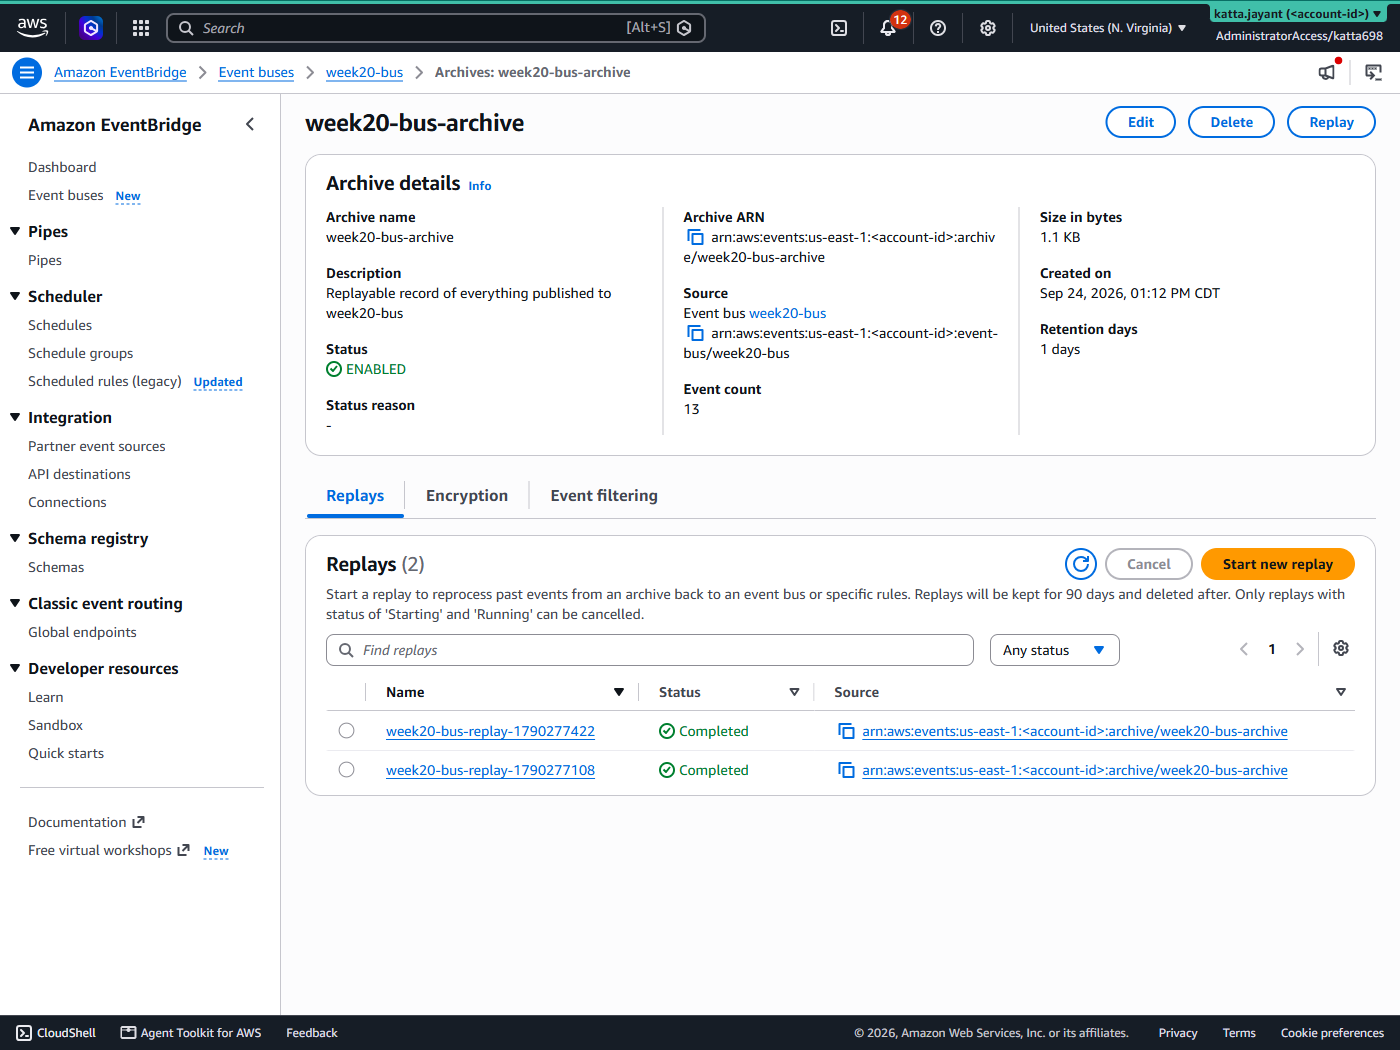
Completed. Nothing here hints at what a replay actually does to routing.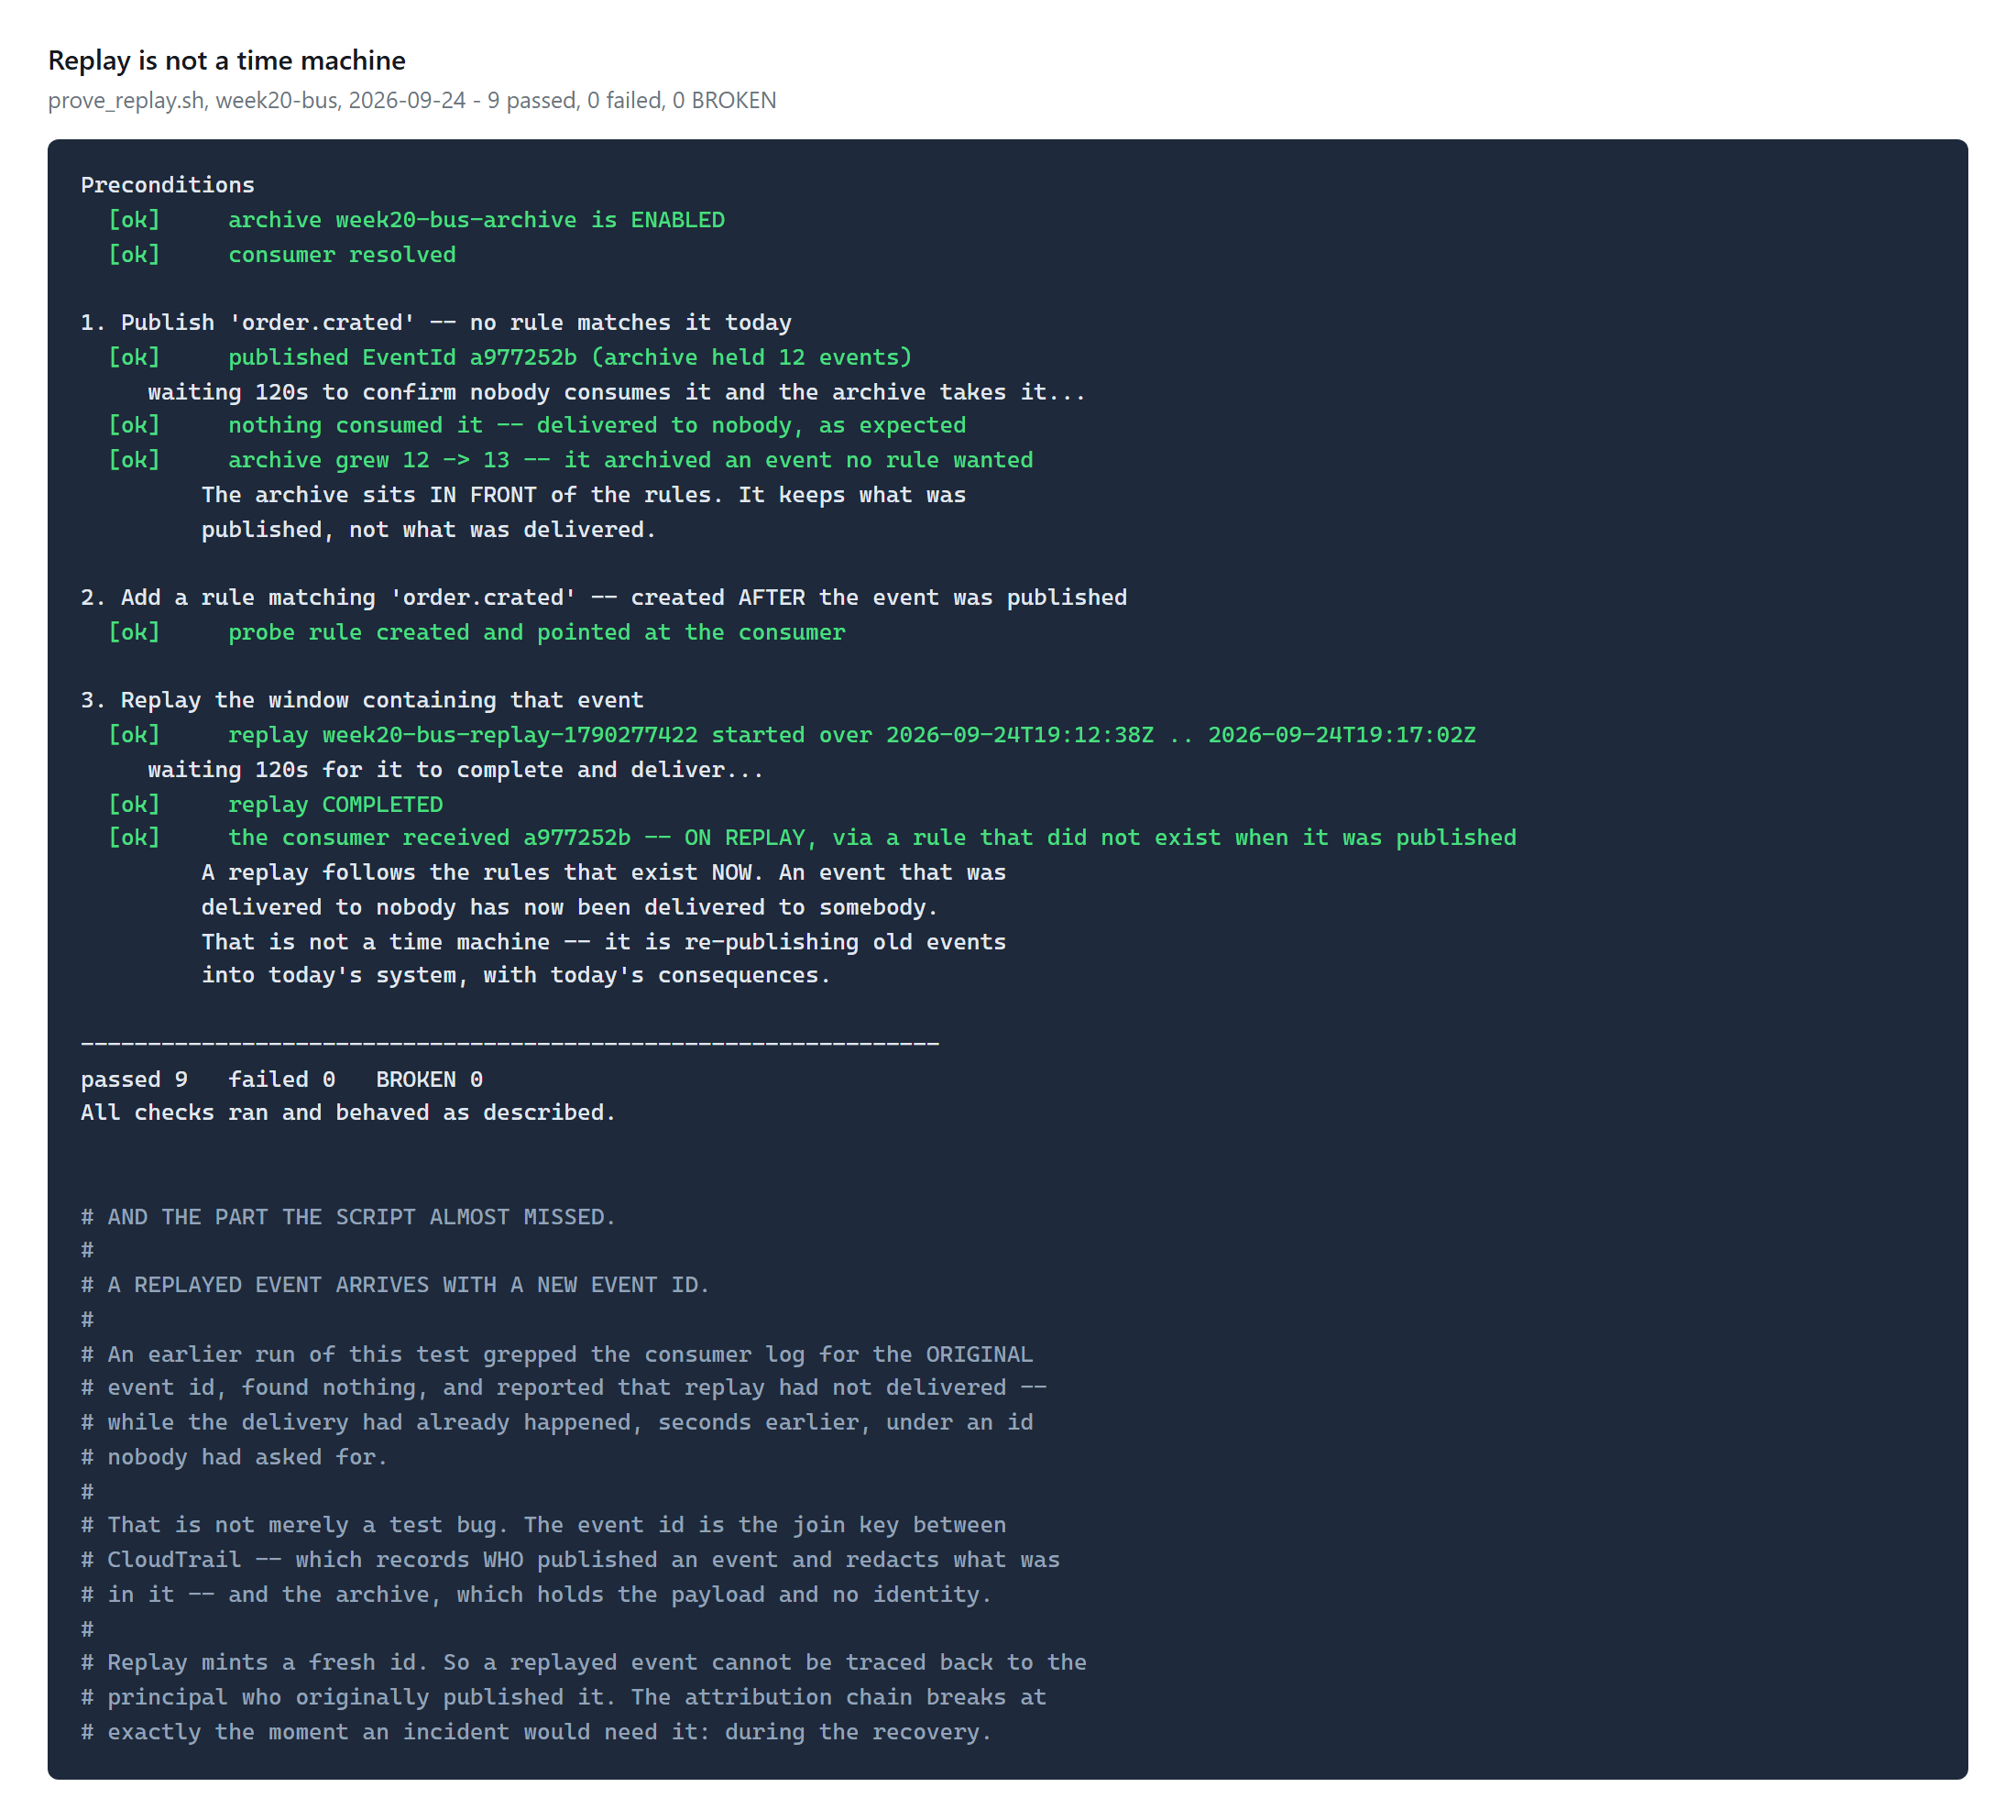
A replay follows the rules that exist now, not the rules that existed when the event was archived. An event originally delivered to nobody has now been delivered to somebody. That is not recovering a past state — it is re-publishing old events into today’s system, with today’s consequences. Worth knowing before you reach for it mid-incident.
And the part that matters more, which caught me the way it would catch anyone: a replayed event arrives with a new event id. My check grepped the consumer log for the original id, found nothing, and reported that replay had not delivered — while the delivery had happened seconds earlier under an id nobody had asked for.
That is not just a test bug. The event id is the join key between CloudTrail, which records who published an event and redacts what was in it, and the archive, which holds the payload and carries no identity. Replay mints a fresh id, so a replayed event cannot be traced back to the principal who originally published it. The attribution chain breaks at precisely the moment an incident would need it.
4. Three measurement bugs, all of which produced confident wrong answers
Worth listing because each one looked like a finding:
filter-log-eventsauto-paginates, and--queryapplies per page — solength(events)came back as two numbers joined by a newline. The symptom was aBROKENcheck announcing that delivery was broken, at a moment when the consumer had been invoked four times.ApproximateNumberOfMessagesVisibleis not a valid SQS attribute name. The API rejected it, both readings defaulted to zero, and the script reported "depth unchanged" — a conclusion drawn from two failed reads.- Archive
EventCountis a periodic statistic, not a live counter. A read sixty seconds after publishing said 10 against a prior 10, and the guard declared the event unarchived. It was archived; the number caught up at about three minutes.
The guards did their job in each case — every one surfaced as BROKEN rather than a pass. That is the whole argument for having a third outcome.
Security — Controls at Every Layer
- No static AWS credentials anywhere. HCP Terraform authenticates by OIDC.
- The trail is scoped by ARN to one bus. An unscoped data-event selector logs every
PutEventsin the account — including other projects’ — and bills for all of it. - The DLQ’s resource policy names the specific rule. Being a dead-letter queue grants a queue nothing; without the
aws:SourceArncondition, any EventBridge rule in any account could write to it. - Log retention set explicitly. An implicitly-created Lambda log group never expires, which is a standing charge nobody thinks to look for.
- Attribution has a documented hole. When another account publishes to your bus through a resource policy, their account receives the CloudTrail data event and yours does not. Owning the bus does not mean seeing who wrote to it.
Cost
Prices as of September 2026 — verify at the EventBridge pricing page.
| Item | Rate | Note |
|---|---|---|
| Custom events | $1.00 / M | ingested |
| Schema discovery | free to 5M/month | then $1.00/M in 8 KB chunks |
| Archive | $0.10/GB + $0.023/GB-month | the only standing charge in this build |
| Replay | $1.00 / M | same rate as publishing |
| CloudTrail data events | billed per event | off by default for a reason |
| Hourly meter | none | no control plane, no NAT, no instance |
The billed total is $0.0000281. Read from Cost Explorer once AWS posted the charges, not calculated from the table above: CloudTrail data events $0.000013 and EventBridge $0.0000151, both incurred on 24 September. The 25th and 26th billed zero with every resource still running.
The rate card would have let me print a number a day earlier. It is worth saying why I waited: this series once published $1.40 for a week against a bill of $4.93, by doing exactly that. A calculation is not a measurement, and the gap between them is not always small.
The opposite shape to the last two weeks
Weeks 18 and 19 built EKS clusters that billed $0.17 and $0.22 per hour from the moment they existed, whether or not anything ran. This build has no hourly meter at all. The measured archive is 1,096 bytes.
That sounds like the safer shape and it is the easier one to forget. A cluster costing $5 a day announces itself. An archive costing fractions of a cent a month, a trail quietly logging data events, and a discoverer metering against a free tier do not — and none of them will ever get your attention on their own.
Cleanup
./scripts/cleanup.shThe sweep checks four things a "delete the bus" pass misses:
- The archive is not deleted with the bus, and its storage keeps billing.
- Discovered schemas outlive the discoverer. They live in the AWS-managed
discovered-schemasregistry and cost nothing, which is exactly why they accumulate — including that typo. - The log-group resource policy is account-level and invisible in the log-group view.
- Rules left on the
defaultbus — which is where they land ifevent_bus_nameis ever omitted from a rule or its target.
The replay test also creates a probe rule outside Terraform, so it removes it on exit via a trap. A script that creates AWS resources outside Terraform creates things the teardown cannot see.
References
- Logging EventBridge API calls with CloudTrail — the data-event table, the redaction note, and the cross-account caveat
- EventBridge data-plane logging to CloudTrail — 4 May 2026
- Dead-letter queues for undelivered events — the error codes, which are all delivery failures
- Amazon EventBridge pricing
- This week’s Terraform, scripts and tests
Key Takeaways
A 200 from PutEvents means the bus accepted your event. Nothing else. Not that anything was listening, not that anything was delivered. An event that matches no rule is a successful publish with no subscriber, and AWS has no opinion about it.
There is no metric for "matched no rule". You get MatchedEvents per rule and nothing for the gap between them. The detection has to be built, and the only way to build it costs you a second delivery of every event.
A schema registry records mistakes as faithfully as intentions. At the wire level a typo and a new event type are indistinguishable, so the typo gets written down as a contract. Discovery is not validation.
Your dead-letter queue probably catches a different failure than you think. The EventBridge DLQ covers "I could not hand this over". A target that accepts an event and then fails needs its own mechanism, elsewhere.
Replay re-publishes into the present. Current rules, new event ids, today’s consequences — and no way back to the original publisher.
What I’d do differently in production
- Put the unmatched-events alarm in from day one, not after an incident. It is the only thing standing between a typo and a silent outage, and it is three resources.
- Scope the catch-all. A catch-all on a high-volume bus doubles delivery cost. Sample it, or route it somewhere cheaper than a log group, or run it only in non-production.
- Configure both failure destinations. The EventBridge DLQ and the target’s own on-failure destination answer different questions, and having one is not having the other.
- Treat the registry as documentation, not a gate. If you need validation, it has to happen in the publisher or in a consumer — EventBridge will not do it for you.
- Write the event id into your own payload. It is the only way a replayed event stays traceable to its original publish, because the envelope id will not survive.
Comments