Business Challenge
A team ran about forty DynamoDB tables, every one of them on-demand. The reasoning was reasonable and entirely unexamined: on-demand is the serverless option, serverless is the modern default, and nobody wanted to forecast capacity for forty tables.
Most of those tables served a business application with the traffic shape you would expect — busy in office hours, quiet overnight, essentially identical week to week. That is about as forecastable as load gets. They were paying per-request rates for a workload whose requests could have been predicted a month in advance.
The interesting part is that “on-demand is more expensive at steady load” is not a useful statement on its own. Steady at what level? The two modes are billed in different units — one per request, one per reserved unit per hour — so until you put them on the same scale there is nothing to compare.
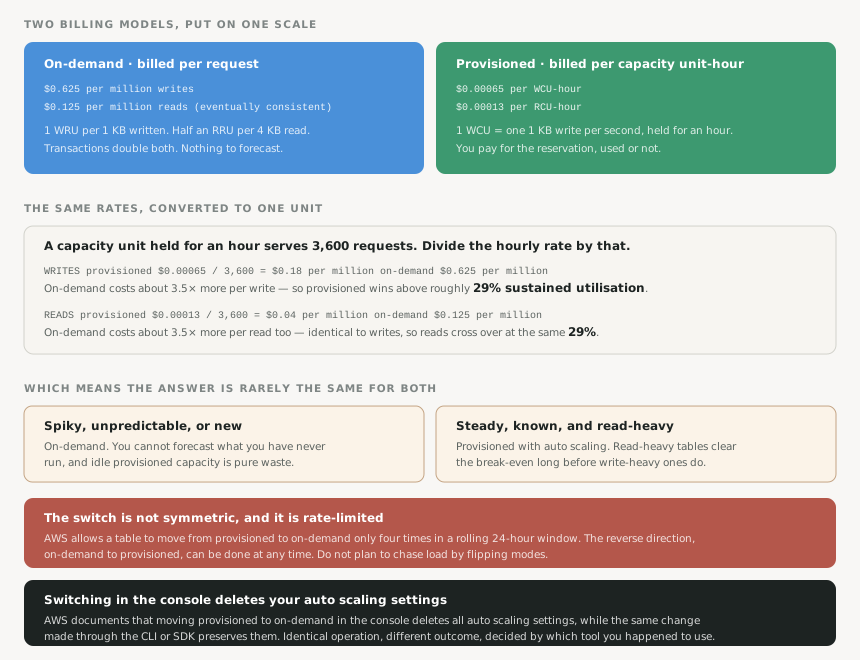
On-demand is $0.625 per million writes. Provisioned is $0.00065 per WCU-hour. Those numbers cannot be compared as written.
One write capacity unit sustains one 1 KB write per second, so held for an hour it
serves 3,600 writes. Divide: $0.00065 / 3,600 is about
$0.18 per million writes at full utilisation. On-demand costs roughly
3.5× that.
Convert both to cost per million requests before arguing about which is cheaper. Everything else follows from that one division.
Provisioned capacity only achieves $0.18 per million if every unit is used every second, which never happens. At half utilisation it is $0.36; at a quarter, $0.72 — more than on-demand.
So the real question is what utilisation makes them equal, and that is simply
$0.18 / $0.625: about 29%. Sustain average write
utilisation above roughly 29% and provisioned is cheaper. Below it, on-demand is, and no
amount of tuning changes that.
Pull ConsumedWriteCapacityUnits against provisioned capacity for a fortnight. The average is the answer.
Running the same arithmetic on reads gives, surprisingly, the same answer.
$0.00013 / 3,600 is about $0.04 per million strongly
consistent reads, against $0.125 per million on-demand — a ratio
of 3.5× and a break-even near 29%. Identical to
writes, to the decimal place.
That is not a coincidence, and it is recent. In November 2024 AWS halved on-demand throughput pricing while leaving provisioned rates alone, which moved both break-even points together. Anything written before that date — including a good deal of advice still circulating — puts reads at roughly half the utilisation writes need. That was true against the old $0.25 read price. It is not true now.
FixOne threshold, not two: about 29% average utilisation on either axis. If a source quotes different break-evens for reads and writes, check the date on its prices.
This one is documented and still surprising. Switching a table from provisioned to on-demand behaves differently depending on how you do it: in the console all of your auto scaling settings will be deleted, while through the CLI or SDK all of your auto scaling settings will be preserved and can be reapplied when you switch back.
Identical operation, different outcome, decided entirely by which tool someone reached for. Try on-demand for a week via the console, switch back, and the carefully tuned scaling policy is simply gone — with the table working perfectly well the whole time on flat capacity.
FixMake mode changes through the CLI or IaC, never the console. Anything reversible should stay reversible.
Architecture
The decision, in the order it should be made
Start on-demand for anything new. You cannot forecast a workload that has never run, and a wrong provisioned figure either throttles users or wastes money. On-demand buys accurate measurements of real traffic, which is exactly what the next step needs.
After a few weeks, compute utilisation per table, per axis. Average consumed capacity against what you would have to provision to serve the peak without throttling. Above roughly 29% on either axis, provisioned wins.
Move only the tables that clear it, and keep auto scaling on. Provisioned without auto scaling means provisioning for peak and paying for peak around the clock, which throws away most of the saving that justified the move.
Auto scaling does not reach the theoretical number
The 29% figure assumes you can safely run capacity right at consumption, and you cannot. AWS's own recommended default target utilisation is 70%, deliberately leaving headroom for scaling to react — it responds to sustained change, not to a spike that arrives in seconds.
So provisioned at a 70% target costs about $0.18 / 0.7, near $0.26 per million
writes. Still well under on-demand's $0.625, but the honest saving on a steady table is
closer to 2.4× than 3.5×. Quote the achievable number, not the
theoretical one.
What happens at the moment of the switch
Switching is not instantaneous and not symmetric. AWS states a table can move from provisioned to on-demand up to four times in a 24-hour rolling window, while the reverse can be done at any time. Any design that flips modes to chase load is therefore not viable.
Throughput during and after the change is also worth knowing. The switch takes several minutes, during which the table serves throughput consistent with its previous provisioned settings. A table moving to on-demand for the first time is scaled to sustain at least 4,000 write units and 12,000 read units per second, or its previous peak if that was higher — and coming back the other way, it delivers throughput consistent with the peak it reached while on-demand.
Why This Architecture Holds Up
It replaces a preference with an arithmetic question
“On-demand versus provisioned” is usually argued as a philosophy — serverless purity against operational control — and that argument has no ending because neither side is describing the workload. Converting both to cost per million requests turns it into a measurement, and measurements can be settled.
It also makes the answer legitimately different per table, which a philosophy cannot. Forty tables do not share one traffic shape, and there is no reason they should share one billing mode.
The threshold is stable even when the prices are not
AWS has changed these rates before and will again. What survives a price change is the method: divide the hourly rate by 3,600, compare to the per-request rate, and the ratio gives the break-even. Re-running that division after a price change takes a minute, whereas a memorised number becomes quietly wrong.
Reserved capacity is a third option, and it is not free of risk
For provisioned tables, reserved capacity offers up to 54% for a one-year term and up to 77% for three years. That is a substantial further saving on the steady tables — but it is a commitment on a resource whose right size you have only recently worked out.
Sequence it accordingly: measure, move to provisioned, run long enough to trust the number, and only then reserve. Committing three years to a figure derived from two weeks of data is how a cost optimisation becomes a cost floor.
Key Architecture Decisions
| Situation | Choose | Because |
|---|---|---|
| New table, unknown traffic | On-demand | Nothing to forecast from. It buys real measurements at a price that scales to zero. |
| Steady load above ~29% write utilisation | Provisioned with auto scaling | Past the break-even, on-demand is roughly 3.5× the per-request cost. |
| Read-heavy table, modest writes | Provisioned reads, judge writes separately | Both cross over near 29%, but the axes are provisioned independently, so one can clear it while the other does not. |
| Sharp, unpredictable spikes | On-demand | Auto scaling reacts to sustained change, not to a spike arriving in seconds. |
| Changing a table's mode | CLI or IaC, never the console | The console deletes auto scaling settings; the CLI and SDK preserve them. |
| Provisioned and stable for months | Consider reserved capacity | Up to 54% for one year, 77% for three — but only once the figure is trustworthy. |
The audit that pays for itself
For every on-demand table, pull ConsumedWriteCapacityUnits and
ConsumedReadCapacityUnits for a fortnight at one-minute resolution. Take the
average and the peak on each axis. Average divided by peak is your achievable utilisation,
and any table over roughly 29% on either axis is currently overpaying. Sort by
total request volume and the list is already in priority order.
Closing Thought
On-demand is not the expensive option and provisioned is not the grown-up one. They are two billing units for the same capacity, and which is cheaper is decided by a number that most teams have never calculated for their own tables — despite it being one division away from metrics they already collect.
What makes this worth doing properly rather than globally is that the answer genuinely varies per table, and per axis within a table. A blanket policy either way is a decision not to look. The version that holds up is unglamorous: start on-demand because you know nothing, measure because it is cheap to, and move the tables that have earned it.
Official AWS Reference
- Amazon DynamoDB pricing — on-demand capacity
- Amazon DynamoDB pricing — provisioned capacity
- Considerations when switching capacity modes in DynamoDB
- DynamoDB provisioned capacity mode
- Amazon DynamoDB reduces prices for on-demand throughput and global tables
- Managing throughput capacity automatically with DynamoDB auto scaling
- Understanding DynamoDB warm throughput
Comments