In This Post
Executive summary
On 10 August 2026, AWS added a fourth type of EC2 status check. Alongside system, instance and attached EBS checks — all managed by AWS and always running — there is now an application status check that sends an HTTP or HTTPS request to a path and port you specify, every 60 seconds, and reports whether your application answered.
You associate it with instances by ID or by tag, including the aws:autoscaling:groupName system tag. Auto Scaling then terminates and replaces any instance whose application reports impaired, with no Auto Scaling group configuration required beyond the association.
Available in all commercial Regions and AWS GovCloud (US). Billing is $0.01 per hour per managed network interface, per Availability Zone — which is not the same thing as per instance, and is explained below.
The thing to understand before you switch it on: a deployment that stops your application is indistinguishable from an application that has crashed. Auto Scaling will replace instances mid-deployment unless you suppress the check first. AWS provides three ways to handle that, and the post ends on which to use when.
What changed
EC2 status checks have answered a narrow question since they existed: is this instance reachable and running? They cannot see inside it. A web server that stopped accepting connections, a Docker daemon that died, an application bound to 127.0.0.1 instead of the network interface — every one of those leaves the instance passing all its checks while serving nothing.
Four types now, and only one is yours to manage
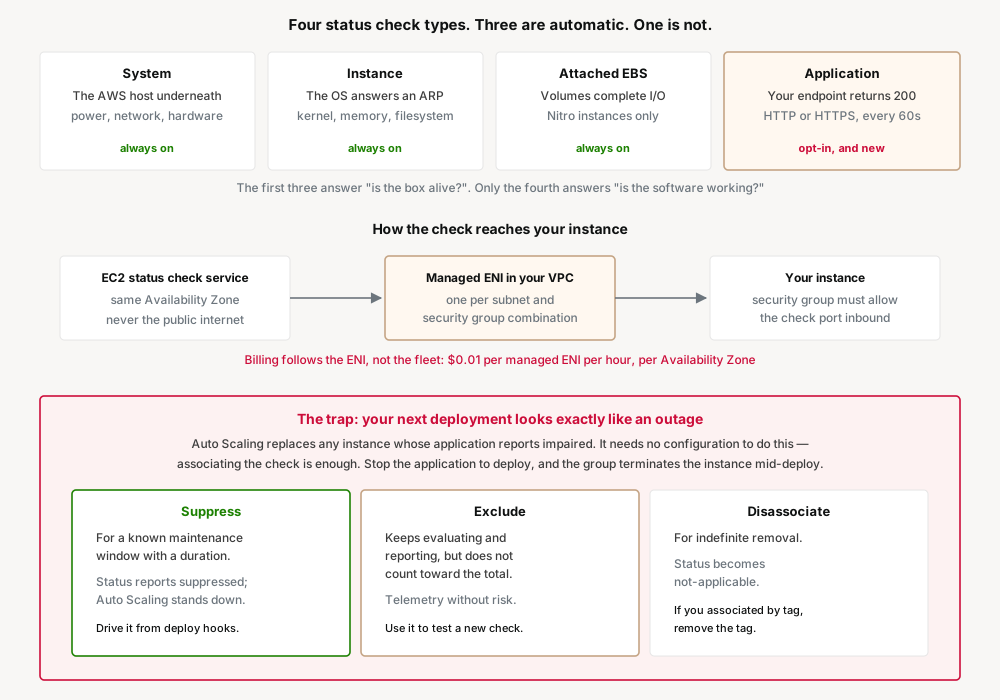
| Check | Detects | Managed by |
|---|---|---|
| System | The AWS host underneath: power, network, hardware | AWS, always on |
| Instance | The OS responds to an ARP request: kernel, memory, filesystem | AWS, always on |
| Attached EBS | Attached volumes can complete I/O (Nitro instances only) | AWS, always on |
| Application | Your endpoint returns an acceptable HTTP status code | You. Opt-in. |
The first three cannot be disabled or deleted. The fourth does not exist until you create it, associate it, and configure it.
What you configure
A check is a protocol, a port, a path, and the response codes you consider healthy. Everything else has a default:
| Setting | Default | Notes |
|---|---|---|
| Check interval | 60 seconds | Fixed. Not configurable. |
FailureThreshold | 2 consecutive failures | Before the check is marked impaired |
SuccessThreshold | 2 consecutive successes | Before it is healthy again |
Timeout | 6 seconds | Range 1-30. Enforced as a hard timeout |
InitializationGracePeriodSeconds | 300 seconds | Range 1-600. Time after launch before evaluation starts |
| Status code matcher | 200 | Redirects are not followed |
| Aggregation | included | excluded reports status without driving Auto Scaling |
Two details that are easy to miss and change behaviour: the request is sent over HTTP/2, and the HTTPS check does not validate the server certificate. It is a reachability and response-code check wearing TLS, not a certificate check.
Why AWS built this
Because application-aware recovery previously required a component whose job was something else entirely.
If you wanted Auto Scaling to replace an instance whose application had died, your options were:
- Put a load balancer in front of it. Set the Auto Scaling group's health check type to
ELBand let the target group's health check drive replacement. This works well, and it is why most people have never needed anything else — but it means running a load balancer for a workload that may not need one, and paying for it. - Write a custom health check. A Lambda on a schedule, probing instances and calling
SetInstanceHealthto mark them unhealthy. AWS has published guidance on this pattern for years, which tells you how common the need is. It is also a distributed system you now own, with its own IAM, failure modes and on-call. - Alarm and page someone. A CloudWatch alarm on an application metric, and a human decides. Correct, and slow.
- Accept it. Let the instance sit in the group serving errors until someone notices.
The gap was sharpest for workloads with no load balancer at all: queue consumers, batch workers, internal services reached by DNS, single-instance applications. Those are exactly the workloads where a silently dead process goes unnoticed longest, and exactly the ones where standing up an ALB purely to get a health check was hard to justify.
Architecture
The model: AWS runs a prober inside your VPC and asks your application a question every minute. Where that prober lives determines both your security group configuration and your bill.
The managed ENI is the part that surprises people
Checks do not originate from outside. AWS creates a managed elastic network interface in your VPC, one per combination of source subnet and security group that has associated instances. It appears when a check first needs it and disappears when no check does.
Three consequences follow, and all three matter:
- Traffic stays on the AWS internal network, from the same Availability Zone as the target. It never touches the public internet.
- The ENI does not count against your instance ENI limit, but it does count against ENIs per VPC. If you are near that quota, AWS cannot create the ENI and the check simply does not run.
- Your instance's security group must allow inbound traffic on the check port from the health check source security group. With AWS-managed network paths, AWS tells you that group at creation.
Two onboarding modes, chosen by one parameter
Omit --health-check-paths and AWS selects the source and destination subnets and security groups for you. Include it and you specify them yourself. The second exists for VPCs with strict segmentation or compliance rules about where probe traffic may originate. There is no separate flag — the presence or absence of that one parameter is the switch.
Association by tag is the powerful part
You can associate by instance ID, or by tag. Associating on aws:autoscaling:groupName covers every instance in an Auto Scaling group, including ones that do not exist yet. That makes the check a property of the group rather than something to remember at launch — and it means changing a tag changes what is monitored, which is worth knowing before someone retags a fleet.
Business value
Self-healing without a load balancer. The clearest win. A queue consumer or batch worker can now be replaced automatically when its process dies, with no ALB, no Lambda, and no code you maintain.
One less bespoke component. If you built the Lambda-and-SetInstanceHealth pattern, this deletes it — along with its IAM role, its schedule, its error handling and the question of who owns it.
Failures surface in the place people already look. Application status appears in describe-instance-status alongside the other checks, in the console, and as the StatusCheckFailed_Application CloudWatch metric. No new dashboard.
Detection in about two minutes. Two consecutive failures at 60-second intervals. Not instant, but considerably faster than a human noticing a queue stopped draining.
Security considerations
The HTTPS check does not validate the server certificate. AWS states this plainly. An expired, self-signed or hostname-mismatched certificate will pass. This is a liveness probe over TLS, not a TLS health check — do not let it stand in for certificate monitoring.
The health check path is an unauthenticated endpoint. AWS's own troubleshooting guidance says a 401 or 403 means the check failed, and to serve health checks on a path that does not require credentials. That path is reachable from inside your VPC by design. Make sure it returns liveness and nothing else — no version strings, no dependency detail, no internal hostnames.
You are opening a port to a new source. The instance security group must accept inbound traffic from the health check source security group. Narrow it to the check port only. With customer-managed network paths you control which subnet and security group that is, which is the reason to use that mode in a segmented VPC.
Whoever can create and associate checks can cause instance replacement. A check with a wrong path, associated by tag to a production fleet, produces rolling terminations. Treat ec2:CreateApplicationStatusCheck and ec2:AssociateApplicationStatusCheck as change-controlled, not general EC2 access.
The ENIs are created by a service-linked role. EC2ApplicationStatusChecksServiceRolePolicy, no IAM setup required. Worth knowing so an unexpected ENI in your VPC is not mistaken for something else during an audit.
Cost considerations
$0.01 per hour per managed ENI, per Availability Zone, plus standard CloudWatch charges for the metrics.
Cost follows network topology, not fleet size. This is the part worth internalising, because it inverts the usual intuition. AWS creates one ENI per combination of source subnet and security group. Ten thousand instances behind one subnet and security group combination is one ENI. Twenty instances spread across ten subnet-and-security-group combinations is ten.
So the driver is how fragmented your network is, not how many instances you monitor:
| Shape | Managed ENIs | Approximate monthly cost |
|---|---|---|
| One subnet, one security group | 1 | $7.30 |
| Three AZs, one security group | 3 | $21.90 |
| Three AZs, four security groups in use | up to 12 | up to $87.60 |
At 730 hours a month. Compared with running an ALB purely to obtain a health check, this is cheap in every one of those shapes — but a heavily segmented estate should count its combinations rather than assume a single line item.
Local Zones cost more. For instances in a Local Zone the managed ENI sits in the parent Region, so check traffic crosses the Local Zone service link and may incur data transfer charges. Worth modelling separately.
Operational considerations
Validate in production without risk, using excluded. Create the check with aggregation set to excluded and it evaluates and reports but does not contribute to overall status or drive Auto Scaling. AWS explicitly recommends this as the workflow for adding a check to an existing production workload. Confirm it reports what you expect, then switch to included. There is no reason to skip this step.
The grace period is the second most common way to cause replacements. InitializationGracePeriodSeconds defaults to 300 and caps at 600. If your application takes longer than that to start listening, Auto Scaling will replace new instances before they are ready — and the replacements will do the same thing. Measure your real cold start, including the slowest case, before enabling.
Exceeding the target quota stops monitoring silently. The default is 5,000 targets per account, where a target is one instance monitored by one check. AWS is explicit: targets over the limit are not monitored and do not report an application status. Nothing fails; coverage just stops. AWS recommends a CloudWatch alarm on quota usage from the AWS/Usage namespace, and that is worth setting up on day one.
| Quota | Default | Adjustable |
|---|---|---|
| Health checks per account | 50 | Yes, automatically |
| Associations per health check | 50 | Yes, automatically |
| Associations per account | 200 | Yes, automatically |
| Targets per account | 5,000 | By request, manual approval |
Redirects fail. Health check calls do not follow them, so a path returning 301 or 302 fails unless you add that code to the matcher. Point the check at the destination instead.
Reason codes tell you why. describe-application-status returns ResponseCodeMismatch, ConnectionTimeout, ConnectionRefused, ConnectionReset or ResponseTimeout, with the actual HTTP status code where there was one. That distinction — refused versus mismatched — is the difference between a firewall problem and an application problem.
Tradeoffs
Against an ALB or NLB target group health check. If you already run a load balancer, its health check does this job, is configurable below 60 seconds, and removes the instance from rotation rather than terminating it. That last difference matters: a load balancer stops sending traffic, while this replaces the instance. Keep the load balancer's check as the traffic-shedding mechanism; application status checks are for workloads with no load balancer at all.
Against a custom Lambda health check. The custom approach can probe anything — a TCP port, a database query, a queue depth, a file on disk. This is HTTP and HTTPS only. If your definition of healthy is not expressible as an HTTP response code, you still need the custom path.
Against a CloudWatch alarm on an application metric. An alarm can watch what the application reports about itself, which is often a better signal than "does it return 200". It also cannot terminate an instance without you wiring that up. Different tools; there is no reason not to run both.
The 60-second interval is fixed. With the default two-failure threshold, that is roughly two minutes to detection and a further replacement cycle before capacity returns. For anything latency-critical, a load balancer's faster health check in front is still the right answer.
Implementation guidance
Prerequisites
- An endpoint on each instance answering HTTP or HTTPS on a known port and path.
- An instance security group allowing inbound on that port from the health check source security group.
- Headroom in your ENIs per VPC quota — without it the managed ENI cannot be created and the check will not run.
- A measured cold-start time, to size
InitializationGracePeriodSeconds.
Create it excluded first
This is the recommended order, and it costs nothing to follow:
aws ec2 create-application-status-check \
    --protocol https \
    --port 443 \
    --path "/health" \
    --status-code-matcher "200" \
    --aggregation excluded
Associate with the Auto Scaling group by tag
aws ec2 associate-application-status-check \
    --application-status-check-id asc-1234567890abcdef0 \
    --target-tag-associations Key=aws:autoscaling:groupName,Value=my-asg
Confirm it reports what you expect
Wait two intervals, then read the per-instance result — including the HTTP code your application actually returned:
aws ec2 describe-application-status \
    --instance-ids i-0123456789abcdef0
Only then let it drive replacement
aws ec2 modify-application-status-check \
    --application-status-check-id asc-1234567890abcdef0 \
    --aggregation included
Wire suppression into your deployment before you do
Pre-deployment hook:
aws ec2 enable-application-status-check-suppression \
    --instance-ids i-0123456789abcdef0 \
    --duration-seconds 3600
Post-deployment hook:
aws ec2 disable-application-status-check-suppression \
    --instance-ids i-0123456789abcdef0
Always pass a duration. If suppression is omitted and the post-deployment hook never runs — a failed pipeline, a cancelled job — the check stays suppressed indefinitely and you have silently switched off the monitoring you just installed.
Best practices
- Create every check
excludedfirst, confirm it, then switch toincluded. - Wire suppression into deploy hooks before enabling aggregation, not after the first incident.
- Always give suppression a duration so a failed pipeline cannot leave monitoring off forever.
- Size the grace period from a measured cold start, worst case, not a guess. The ceiling is 600 seconds.
- Alarm on the targets-per-account quota via the
AWS/Usagenamespace — exceeding it stops monitoring silently. - Serve the health path unauthenticated and content-free. Liveness only.
- Associate by Auto Scaling group tag so new instances are covered automatically.
- Do not treat the HTTPS check as certificate validation. It does not validate the certificate.
- Count your subnet and security group combinations before estimating cost, not your instances.
Who should adopt, who should wait
Adopt
- Workloads with no load balancer — queue consumers, batch workers, internal services, single-instance applications. This is the case the feature exists for.
- Anyone running a custom Lambda health check calling
SetInstanceHealth. This replaces it. - Teams who have been bitten by a process that died while the instance stayed healthy.
- GovCloud (US) workloads, which have it at launch.
Wait
- Fleets already behind a load balancer with a working target group health check. You have this already, with faster intervals and traffic shedding instead of termination.
- Health definitions not expressible as an HTTP response code — queue depth, replication lag, a TCP port with no HTTP on it.
- Applications with cold starts beyond 600 seconds. The grace period cannot cover you.
- Teams without deployment hooks to drive suppression. Read the next section before deciding.
- Anyone near their ENIs per VPC quota — the check will not run and will not tell you loudly.
The trap: your next deployment
This deserves its own section because the feature works exactly as designed while doing it, and because the blast radius is a whole Auto Scaling group.
An application stopped for a deployment is indistinguishable from an application that has crashed. Auto Scaling replaces any instance whose overall application status is impaired, and it needs no configuration to do so — associating the check is enough. Deploy by stopping the process, and the group terminates the instance you are deploying to.
The failure is worse than one lost instance. A rolling deployment stops the application on the next instance, which is replaced, which launches fresh and starts the deployment again. Capacity churns while the pipeline reports progress. Nothing errors, because nothing is wrong: the check saw an application that was not answering, and did what you asked.
AWS gives three ways out, and they are not interchangeable:
| Option | Use when | Status becomes |
|---|---|---|
| Suppress | A bounded maintenance window with a known duration. Driven from pre- and post-deployment hooks. | suppressed — Auto Scaling stands down |
| Exclude from aggregation | Longer-lived: validating a new check, or keeping telemetry without operational impact. | Individual status still reported, ignored by Auto Scaling |
| Disassociate | Indefinite removal. If you associated by tag, remove the tag. | not-applicable |
For deployments, suppression is the right one, and it belongs in the pipeline rather than in a runbook. AWS's guidance is a pre-deployment hook that suppresses with a duration covering the expected window, and a post-deployment hook that lifts it. If your deployment tool has no hooks, drive it from whatever invokes the deployment.
The failure mode to design against is the one where the post-deployment hook never runs. A cancelled pipeline, a failed step, an operator interrupt — and the check stays suppressed. Always pass --duration-seconds, so the worst case is monitoring resuming late rather than never. Suppression without a duration lasts until someone explicitly disables it, and nobody will remember.
Key takeaways
- A fourth EC2 status check type. The other three are managed by AWS and always on; this one is opt-in and yours to configure.
- HTTP or HTTPS to a path and port you choose, every 60 seconds — fixed, not configurable.
- Auto Scaling replaces impaired instances with no group configuration beyond associating the check.
- A deployment looks like a crash. Suppress from deploy hooks, always with a duration.
- Create checks
excludedfirst, confirm, then setincluded. AWS recommends this explicitly. - The HTTPS check does not validate the server certificate.
- Cost is $0.01 per managed ENI-hour per AZ — driven by subnet and security group combinations, not instance count.
- Exceeding 5,000 targets per account stops monitoring silently. Alarm on quota usage.
InitializationGracePeriodSecondsdefaults to 300 and caps at 600. Slower cold starts will be replaced before they are ready.- Associate by
aws:autoscaling:groupNameto cover instances that do not exist yet.
Official AWS references
- Amazon EC2 introduces application status checks
- Application status checks, Amazon EC2 User Guide
- Status checks for Amazon EC2 instances
- About the health checks for your Auto Scaling group
- Health checks for instances in an Auto Scaling group
- CreateApplicationStatusCheck API reference
- EC2ApplicationStatusChecksServiceRolePolicy
- Amazon EC2 endpoints and quotas
- How to create custom health checks for your Amazon EC2 Auto Scaling fleet
Comments