EC2 gained a performance status check for accelerated instances: hardware degradation that leaves the instance running and reachable. The capability is genuinely new. The thing to check today is what it does to an alarm you wrote years ago.
“If a performance status check fails, Amazon EC2 increments the StatusCheckFailed_Performance metric. A failed performance status check also increments the StatusCheckFailed metric.”
Executive summary
“EC2 performance status checks identify nonterminal hardware conditions that impact performance on accelerated computing instances”, and “These checks also recommend an action, such as rebooting to complete GPU memory row remapping without replacing the instance.” They are “available at no additional charge”, in “all commercial AWS Regions and the AWS GovCloud (US) Regions”.
Alongside them, Detailed Monitoring gained “support for OpenTelemetry metrics, one-minute GPU metrics that help teams tune accelerated workloads, and a new, higher resolution 10-second CPU utilization metric that helps customers size and scale compute capacity using EC2 Auto Scaling”, which are “opt-in and incur standard CloudWatch charges”.
The documentation then supplies two facts the announcement does not. EC2 now has “five types of status checks: system, instance, attached EBS, application, and performance” — most people carry two in their heads. And the new check feeds the aggregate metric that existing automation is built on.
What changed
Every status check before this one answered a binary question about availability. System checks cover “the AWS systems on which your instance runs” and “detect underlying problems with your instance that require AWS involvement to repair”. Instance checks cover “the software and network connectivity of your individual instance” and “detect problems that require your involvement to repair”. Either way, something was unreachable.
The performance check is a different category: “Performance status checks monitor for hardware issues that impact accelerated computing instance performance without making the instance unreachable. These issues do not require scheduled maintenance.”
That is a condition the model had no way to express before. A GPU quietly losing memory capacity is not a failed instance and not a scheduled retirement — it is an instance that passes every check while doing less work than you are paying for. Previously the only signal was your own benchmark numbers drifting.
And the remedy is unusually specific for a status check: “a graphics processing unit (GPU) memory error can require an instance reboot to reset the GPU and trigger row remapping, which resolves the issue without replacing the instance.”
Architecture
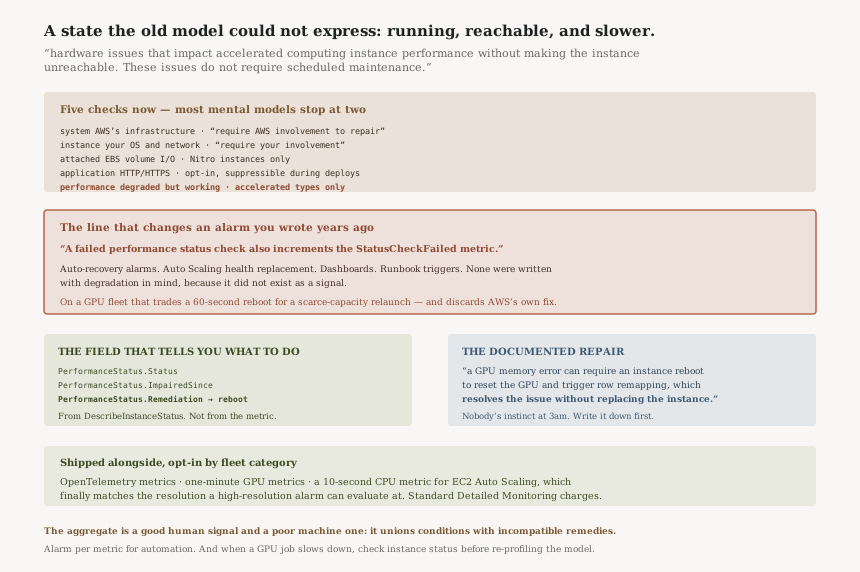
Five checks, and what each one means
| Check | Covers | Runs on | Whose problem |
|---|---|---|---|
| System | “the AWS systems on which your instance runs” | Every instance | AWS — “require AWS involvement to repair” |
| Instance | “the software and network connectivity of your individual instance” | Every instance | Yours |
| Attached EBS | Whether attached volumes can complete I/O | Nitro instances only | Either — wait or replace |
| Application | HTTP and HTTPS responses, opt-in | Instances you associate | Yours |
| Performance | Degradation without unreachability | Supported accelerated types | Yours, usually a reboot |
Four of the five “are managed by Amazon EC2 and cannot be disabled or deleted”, which matters for the next section: you cannot opt out of the new check, only out of acting on it.
The interaction to check today
All status checks share one aggregation rule: “Status checks are performed every minute, returning a pass or a fail status. If all checks pass, the overall status of the instance is OK. If one or more checks fail, the overall status is impaired.”
And the new check joins that aggregate. A performance failure increments its own
StatusCheckFailed_Performance metric and
“also increments the StatusCheckFailed metric”.
Consider what is already watching StatusCheckFailed in a mature estate. Auto-recovery
alarms, since the documentation points at exactly that:
“You can also create an Amazon CloudWatch alarm that monitors an Amazon EC2 instance and
automatically recovers the instance if it becomes impaired due to an underlying issue.”
Auto Scaling health replacement. Dashboards. Runbook triggers. None of them were written with
performance degradation in mind, because it did not exist as a signal.
So on a GPU fleet, an alarm whose intent was this instance is broken, replace it can now fire for a condition whose documented fix is a reboot — one that “resolves the issue without replacing the instance”. Replacing it instead is not catastrophic, but on accelerated capacity it trades a sixty-second reboot for a scarce-instance relaunch, and it discards the specific remedy AWS went to the trouble of recommending.
The field that carries the recommendation
“The PerformanceStatus object returned by DescribeInstanceStatus includes the Status, ImpairedSince, and Remediation fields. If Status is impaired, check Remediation for the recommended action”, and “if Remediation is reboot, reboot the instance to clear the issue and return it to service without replacement.”
Two things follow. Remediation is a machine-readable instruction, so the correct
automation reads it rather than guessing — this is the rare case where AWS tells you what to do
in a field. And ImpairedSince gives you duration, which is what distinguishes a transient
blip from a degraded instance that has been quietly underperforming for a week.
Neither field is available through the metric. The metric tells you a check failed; only
DescribeInstanceStatus tells you which check and what to do about it.
The metrics shipped alongside
“support for OpenTelemetry metrics, one-minute GPU metrics… and a new, higher resolution 10-second CPU utilization metric”, with the purpose stated: the 10-second metric “helps customers size and scale compute capacity using EC2 Auto Scaling”.
A 10-second CPU metric is a meaningful change for scaling policy, because it matches the resolution a high-resolution CloudWatch alarm can evaluate at. The one-minute default has always been the floor on how fast a reactive scaling decision could be made from CPU; this lowers it. The opt-in shape is fleet-friendly — “Customers can selectively opt into these new metrics using categories that they can easily apply to their instances across their fleet” — and the cost is the usual Detailed Monitoring bill rather than something new.
Business value
The value is concentrated and large for anyone running accelerated capacity. A GPU with remappable memory errors degrades throughput without failing anything, so the cost shows up as training jobs taking longer or inference latency creeping — attributed to the model, the data or the code long before anyone suspects the hardware. A check that names it, with a reboot that fixes it, converts an unexplained performance regression into a one-line operation.
It is also free and cannot be turned off, so the signal exists on every supported instance whether or
not anyone acts on it. That makes it available retrospectively: the next time a GPU job is
inexplicably slow, ImpairedSince is a question you can now ask.
The 10-second CPU metric is narrower but real for latency-sensitive autoscaling, where a minute of averaging is the difference between scaling during a spike and scaling after it.
Security considerations
Little changes here, and that is worth stating. These are platform-side observations delivered “without setup within the instance”, so no agent, no in-guest credential and no new network path. For a hardened or regulated fleet that is the appealing property: visibility that does not require installing anything.
Reading the recommendation needs an API permission, not an agent. The
Remediation field comes from DescribeInstanceStatus, so whatever automation
acts on it needs that call rather than host access.
Application status checks are the one with a new exposure, since they probe an HTTP path you nominate. Worth noting they can be quieted deliberately: “You can suppress application status checks during application restarts or deployments to avoid false-positive failures during expected downtime.”
Cost considerations
The split is clean. Performance status checks are “available at no additional charge”. The metrics are not: “EC2 Detailed Monitoring metrics are opt-in and incur standard CloudWatch charges for EC2 Detailed Monitoring.”
The cost to model is the 10-second CPU metric across a large fleet. Higher resolution means more datapoints per instance per hour, and the saving it enables — scaling sooner, so running less idle capacity — has to cover that. On a small fleet of latency-sensitive instances the trade is obvious; applied fleet-wide by default it is a bill nobody asked for, which is presumably why the opt-in is category-based rather than global.
Against that, the performance check can save real money on accelerated instances, where a reboot instead of a replacement avoids both the relaunch and the risk of not getting the capacity back.
Operational considerations
Audit every alarm on StatusCheckFailed first. On accelerated instances
that metric now has a new contributor with a different correct response. This is the one action to take
this week.
Split your alarms by metric rather than using the aggregate.
StatusCheckFailed_System, StatusCheckFailed_Instance,
StatusCheckFailed_AttachedEBS and StatusCheckFailed_Performance each imply a
different action, and the aggregate deliberately erases that distinction.
Have automation read Remediation instead of assuming. It is a field
designed to be read, and the documented value reboot is not what most impairment
automation does.
Remember the check cannot be disabled. Four of the five are “managed by Amazon EC2 and cannot be disabled or deleted”, so the signal arrives whether your runbooks are ready or not.
Treat ImpairedSince as the triage field. A minute of impairment and a
week of it are different incidents with the same metric value.
Tradeoffs
| Choice | What you gain | What it costs |
|---|---|---|
Alarm on aggregate StatusCheckFailed |
One alarm covers every impairment type | Performance degradation triggers replace-the-instance logic |
| Alarm per specific metric | Each response matches the actual fault | Four alarms per instance instead of one |
Automate on Remediation |
Does what AWS recommends, including reboot-not-replace | Needs DescribeInstanceStatus in the loop, not just a metric alarm |
| 10-second CPU metrics fleet-wide | Faster, more accurate scaling decisions | Six times the datapoints of one-minute monitoring, billed |
| 10-second CPU on latency-sensitive groups only | The benefit where it pays | Category management per fleet segment |
Implementation guidance
Inventory your StatusCheckFailed alarms and note which touch accelerated
instances. Those are the ones whose meaning changed without anyone editing them.
Add a StatusCheckFailed_Performance alarm whose action is a reboot, and
exclude performance from whatever currently replaces instances, so the two paths do not race.
Query DescribeInstanceStatus for PerformanceStatus on your GPU fleet
now. The check is already running and free, so any existing impairment is visible today
— and ImpairedSince may explain a performance complaint you have been carrying.
Opt into the 10-second CPU metric by category, for the groups whose scaling is actually latency-bound, rather than everywhere.
Best practices
Keep the per-check metrics as your automation inputs and the aggregate as a dashboard summary. The aggregate is a good human signal and a poor machine one, precisely because it unions conditions with incompatible remedies.
Write the reboot path down before you need it. A reboot on an accelerated instance to trigger row remapping is a legitimate, documented repair, and it will not be anyone's instinct at three in the morning.
When a GPU workload slows down, check instance status before re-profiling the model. That ordering is new, cheap, and the whole point of the feature.
Who should adopt this and when
Act now if you run accelerated instances at all. Not to enable anything — the check is already on and free — but to check what your existing aggregate alarms will do with it.
Act now if any automation replaces instances on StatusCheckFailed. That
is the specific combination where this launch changes behaviour you did not choose.
Adopt the 10-second CPU metric selectively, where scaling latency is a known problem rather than as a default.
Nothing to do on non-accelerated fleets, where performance status checks do not run — though the five-check model is still worth knowing, since most mental models stop at two.
Key takeaways
The new check describes a state the old model could not:
“hardware issues that impact accelerated computing instance performance without making the
instance unreachable”, with a Remediation field that may say
reboot and resolve it
“without replacing the instance”.
The line that changes existing behaviour: “A failed performance status check also increments the StatusCheckFailed metric.” Alarms written for terminal failures now fire for a degraded-but-working instance.
And EC2 has “five types of status checks: system, instance, attached EBS, application, and performance” — four of them mandatory, one opt-in, and only one of them about speed.
Official AWS references
- Amazon EC2 launches performance status checks and new utilization metrics for EC2 Detailed Monitoring — the announcement: nonterminal hardware conditions on accelerated instances, the recommended action including rebooting for GPU memory row remapping, OpenTelemetry metric support, one-minute GPU metrics and the 10-second CPU utilization metric for Auto Scaling, category-based opt-in, the no-additional-charge statement for the checks and standard Detailed Monitoring charges for the metrics, and availability in all commercial Regions and GovCloud (US)
- Status checks for Amazon EC2 instances — that EC2 provides five types of status check and which run where, the per-minute pass or fail cadence and the impaired aggregation rule, which checks cannot be disabled, what system and instance checks each cover and whose involvement they need, the Nitro-only attached EBS metric, application status check suppression, the performance status check definition and GPU row-remapping example, the
PerformanceStatusobject with itsStatus,ImpairedSinceandRemediationfields, and that a performance failure increments bothStatusCheckFailed_Performanceand the aggregateStatusCheckFailed - Automatic instance recovery — further reading on the recovery action an impairment alarm can trigger; no claims in this post are drawn from it
- Status check metrics — further reading on the individual
StatusCheckFailed_*metrics and their dimensions; no claims in this post are drawn from it - Accelerated computing instance types — further reading on which instance families support performance status checks; no claims in this post are drawn from it
Comments