The scaling story is the real one: define checks once for a catalog and every table in it gets them, including tables that do not exist yet. The part to think about before switching it on is what happens to an anomaly nobody looks at, because the documented answer is that it becomes normal.
“When an anomaly is detected, it is considered normal for subsequent runs. The machine learning algorithm will consider this anomalous value as input unless it is explicitly excluded.”
Executive summary
“AWS Glue Data Catalog introduces data quality monitoring for catalogs and databases, powered by AWS Glue Data Quality, which profiles and evaluates your tables at catalog scale from a single configuration”. The scoping is the feature: “You define data quality checks once for a catalog, a database, or a single table, and AWS Glue Data Quality evaluates every table in scope, including tables added later, on the cadence you choose”.
Triggers are flexible and one option is new: “evaluations run on a schedule or whenever table metadata changes, including every Apache Iceberg commit”. Results go “through the existing AWS Glue Data Quality APIs” or, opt-in, to Iceberg tables or S3. It is available “in all AWS Commercial, AWS GovCloud (US), and AWS China regions”.
The anomaly detection is the headline — “After three runs on a table, AWS Glue Data Quality flags anomalous statistics that drift outside expected bounds, surfacing changes that no rule covers” — and it is the part whose documented behaviour changes how you should deploy this. It needs feedback it will not get at catalog scale, its default mode does not match the trigger being promoted, and it is billed per statistic here while being free in the other place you can run it.
What changed
Previously a DQDL ruleset was attached to a table or run inside an ETL job. The unit of configuration is now the catalog or the database, and membership is dynamic — tables added later inherit the checks with no action.
That removes the failure mode where a new table lands in a governed database and simply has no quality checks because nobody remembered. In a lake where tables arrive from pipelines rather than from people, that is most of them.
You can supply “built-in profiling options that AWS Glue provides for common baseline statistics” or your own DQDL ruleset “with analyzers, rules, or both”. Rules assert expectations; analyzers gather statistics without asserting anything. Useful detail if you use both: “AWS Glue Data Quality will gather statistics only once, even if you have both Rule and Analyzer for the same columns”.
Architecture
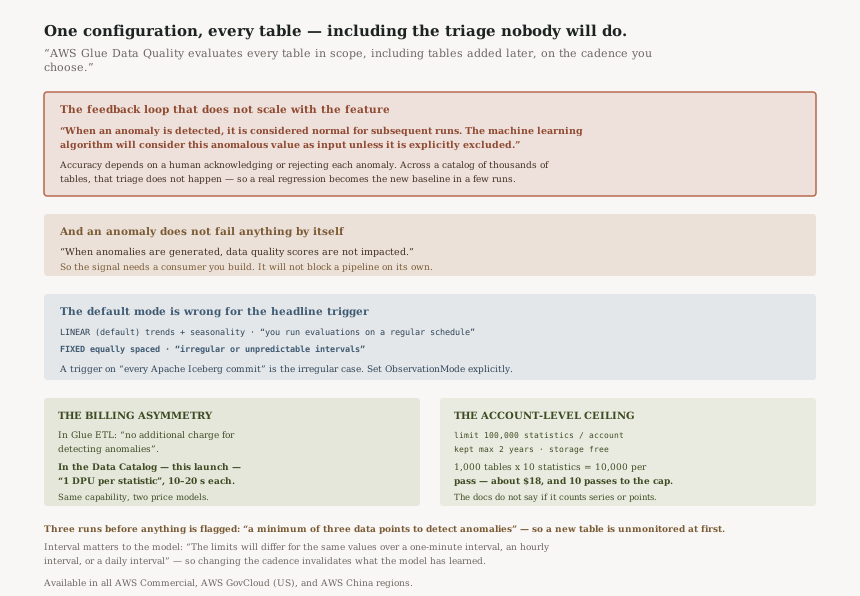
The feedback loop, and why catalog scale breaks it
Anomaly detection here is not a threshold. It learns: “AWS Glue Data Quality requires a minimum of three data points to detect anomalies”, then predicts a range and flags values outside it. Fine so far.
What matters is what happens next. “Retraining the anomaly detection model is critical to detect the right anomalies. When anomalies are detected, AWS Glue Data Quality includes the anomaly in the model as a normal value.” The documentation is explicit that correcting this is a human action — acknowledging or rejecting the anomaly through Glue Studio or the APIs.
Per table, with an owner watching, that is a reasonable design. Applied to a catalog it inverts. A row count that halves because an upstream extract silently failed gets flagged once. If nobody rejects it, the model takes the halved value as a legitimate observation, and within a run or two the new normal is the broken normal. The detector quietly stops being able to see the problem it detected.
And it will not have blocked anything on the way past: “When anomalies are generated, data quality scores are not impacted.” An anomaly is an observation, not a failure. Nothing downstream fails because of one unless you build the thing that makes it fail.
So the honest reading is that this launch scales the generation of anomalies without scaling the triage of them. Which is fine — as long as you deploy it knowing that is what you bought, and put the queue somewhere a person actually works.
The default mode does not match the headline trigger
There are two modes. “Linear (default) models trends and seasonality in your data over time”, and the documentation says to use it when evaluations run on a regular schedule. “Fixed treats all data points as equally spaced regardless of the actual time intervals between evaluation runs”, for irregular or unpredictable intervals. “If you do not specify a mode, anomaly detection uses the LINEAR mode by default.”
Now put that beside the trigger the announcement leads with: evaluations that run “whenever table metadata changes, including every Apache Iceberg commit”. Commits are not a schedule. A table might get forty in an hour during a backfill and none for two days.
That is the textbook case for FIXED, and the default is LINEAR. Worse, the
interval is load-bearing for the model:
“The limits will differ for the same values over a one-minute interval, an hourly interval,
or a daily interval.” A trend-and-seasonality model fed irregularly spaced points will
produce bounds that reflect commit cadence as much as data behaviour.
| How you trigger evaluations | Mode to set | Why |
|---|---|---|
| Nightly or hourly schedule | LINEAR (default) | Regular spacing; trends and seasonality are real signal |
| On every Iceberg commit | FIXED, explicitly | Irregular intervals; documented as the Fixed case |
| On metadata change, low-churn tables | FIXED | Long unpredictable gaps between points |
| Mixed estate | Separate configurations | Mode is set per run, so one cadence per configuration |
The mode is set with ObservationMode in AdditionalRunOptions, alongside the
ObservationScope: ALL that enables anomaly detection for Catalog tables at all. Both are
opt-in fields, which means the quiet path — create a configuration, accept the defaults —
gives you the schedule-shaped model regardless of how you actually trigger it.
Cost is per statistic, and free somewhere else
“Every statistic is charged 1 DPU for the time it takes to detect anomalies.” The pricing page puts a duration on it: “You will incur 1 DPU per statistic for the time it takes to detect anomalies. On average, it takes between 10 -20 seconds to detect anomaly for 1 statistic”, against “$0.44 per DPU-hour, billed per second with a 1-minute minimum”.
At the 15-second midpoint that is roughly $0.0018 per statistic. A thousand tables carrying ten statistics each is 10,000 statistics, or about $18.33 per full catalog pass for the anomaly detection alone, before the evaluation tasks that produced the statistics. Modest per pass; the variable is how often your trigger fires, and the Iceberg-commit trigger is the one that can fire a lot.
The asymmetry is the thing worth knowing: “There is no additional charge for detecting anomalies in AWS Glue ETL jobs.” The same capability, on the same statistics, is free inside an ETL job and billed per statistic in the Data Catalog. If your tables are already written by Glue ETL jobs, running detection there instead is a legitimate cost decision rather than a workaround.
The account-level ceiling nobody mentions
“There is no cost to store the statistics. However, there is a limit of 100,000 statistics per account. These statistics will be stored for maximum of two years.”
Catalog-scale configuration meets an account-scale cap. At 10,000 statistics per pass that is 10 passes before the limit, on the reading that the cap counts stored statistics cumulatively. The documentation does not say whether 100,000 counts distinct statistic series or individual stored data points, and the difference is enormous — so this is a limit to measure against your own catalog early rather than a number to plan around confidently.
Either way it is an account-level resource that a single catalog-wide configuration can consume on behalf of every other user of that account. Worth knowing before enabling it broadly in a shared account.
Business value
The dynamic-membership property is what justifies this. Data quality coverage decays because tables are created faster than checks are attached to them, and every catalog has a long tail of tables nobody ever configured. Scoping checks to a database and having new tables inherit them fixes the decay rather than the symptom.
Analyzers without rules is underrated here. For a catalog you do not understand well enough to write assertions about, gathering baseline statistics on everything and letting drift surface is genuinely more useful than a handful of carefully authored rules on the five tables somebody had time for.
The Iceberg-commit trigger is the most interesting operational capability, because it moves evaluation from a schedule to the actual event that changes the data. Just set the mode to match.
Security considerations
Statistics are data about data, and some of them are close to being data. Column-level statistics such as minimums, maximums and distinct counts can disclose information about a sensitive column to anyone who can read the quality results — a minimum and maximum on a salary or date-of-birth column is a meaningful leak even without a single row.
The statistics are stored in the Glue service and can be encrypted with customer-managed KMS keys. If you opt in to writing results to Iceberg tables or S3, that output is a new copy of this metadata in a location with its own access policy, and it should be treated as being as sensitive as the most sensitive column it profiles.
A catalog-wide configuration is also a broad grant by construction: the role running evaluations needs read access to every table in scope. Scoping to a database rather than a whole catalog keeps that blast radius proportionate.
Cost considerations
Two charges: the evaluation tasks that produce statistics, at “$0.44 per DPU-hour, billed per second with a 1-minute minimum”, and anomaly detection at 1 DPU per statistic. The one-minute minimum matters at catalog scale, because a very fast evaluation on a small table still bills a minute of its DPUs.
The cost driver is trigger frequency multiplied by tables in scope multiplied by statistics per table. A catalog-wide configuration on an Iceberg lake with per-commit triggers multiplies all three at once, which is the combination to model before enabling rather than after.
Run anomaly detection in Glue ETL where the tables are already produced by Glue ETL, since there it carries no additional charge.
Operational considerations
Decide who reads the anomalies before you generate them. Results surface through the Glue Data Quality APIs, so the queue needs a consumer — a ticket, a channel, an owner per database. Without one, the feature is generating observations that will be absorbed back into the baseline unreviewed.
New tables are unmonitored at first: three data points are required before anything can be flagged, so a table created today is not protected by anomaly detection today. Rules, unlike anomalies, work on the first run.
Do not change the evaluation cadence casually once a model has learned, since the bounds depend on the interval between points.
Tradeoffs
| Approach | What you get | What it costs |
|---|---|---|
| Catalog-wide profiling with analyzers | Coverage of every table including future ones, with no authoring | Per-statistic cost, account statistic cap, and an anomaly queue nobody owns yet |
| Database-scoped DQDL rulesets | Assertions that actually fail, on a proportionate blast radius | Authoring effort, and rules go stale as the business changes |
| Anomaly detection in Glue ETL instead | The same detection at no additional charge | Only covers tables written by Glue ETL jobs |
| Per-commit triggers on Iceberg tables | Evaluation tied to the event that changed the data | Unpredictable cost, and FIXED mode must be set explicitly |
Implementation guidance
Start with one database rather than a catalog, with built-in profiling and a schedule. Measure the statistics produced per table and the DPU time consumed over a week, then extrapolate before widening scope.
Set ObservationScope: ALL to get anomaly detection at all, and set
ObservationMode deliberately — FIXED for metadata-change and
per-commit triggers, LINEAR only where evaluations genuinely run on a schedule.
Wire the results API to something a person reads, and make acknowledging or rejecting an anomaly part of that workflow. That single step is what keeps the model from learning your outages as normal.
Best practices
- Set the observation mode explicitly; the default assumes a regular schedule.
- Give every anomaly a reviewer, because an unreviewed anomaly is absorbed as normal.
- Use rules, not anomalies, for anything that must actually fail — anomalies do not affect the score.
- Scope to a database rather than a catalog, to bound both the IAM grant and the cost.
- Treat statistics output as sensitive metadata; encrypt it and restrict the opt-in S3 or Iceberg destination.
- Measure against the 100,000-statistic account limit early, since the documentation does not define what it counts.
Who should adopt this and when
Now: teams with a governed database whose table count grows faster than their check coverage. Built-in profiling on a database scope, on a schedule, is a clear improvement over nothing and needs no DQDL authoring.
Now, with a reviewer named: anyone turning on anomaly detection. The feature's accuracy is a function of someone triaging its output.
Model the cost first: Iceberg-heavy lakes considering per-commit triggers across a catalog. That is the configuration where all three cost multipliers move together.
Key takeaways
The scaling is genuine and well designed: “AWS Glue Data Quality evaluates every table in scope, including tables added later, on the cadence you choose”, which attacks the real reason quality coverage decays.
The sentence to plan around: “When an anomaly is detected, it is considered normal for subsequent runs.” Generating anomalies across a catalog without triaging them produces a detector that learns to ignore your failures, and anomalies do not affect the quality score in the meantime.
Two concrete defaults to override: the mode, because LINEAR assumes a schedule and the
headline trigger is per-commit; and the venue, because detection is billed per statistic in the
Catalog and carries
“no additional charge for detecting anomalies in AWS Glue ETL jobs”.
Official AWS references
- AWS Glue Data Catalog introduces data quality monitoring for catalogs and databases — the announcement: profiling and evaluation at catalog scale from a single configuration, checks defined once for a catalog, database or table covering every table in scope including tables added later, built-in profiling or a custom DQDL ruleset with analyzers and rules, triggers on a schedule or on table metadata changes including every Apache Iceberg commit, anomalous statistics flagged after three runs, results through the existing APIs or opt-in to Iceberg tables or S3, and availability in all Commercial, GovCloud (US) and China regions
- Anomaly detection in AWS Glue Data Quality — the minimum of three data points, that a detected anomaly is considered normal for subsequent runs and is included in the model unless explicitly excluded, that retraining through acknowledgement or rejection is critical, that anomalies do not impact data quality scores, the Linear and Fixed observation modes with Linear as the default, that bounds differ by evaluation interval, that statistics are gathered only once when a rule and analyzer overlap, the charge of 1 DPU per statistic, and the free storage with a 100,000-statistic account limit retained for a maximum of two years
- AWS Glue pricing — the $0.44 per DPU-hour rate billed per second with a 1-minute minimum, that anomaly detection incurs 1 DPU per statistic taking on average 10 to 20 seconds per statistic, and that there is no additional charge for detecting anomalies in AWS Glue ETL jobs
- Getting started with AWS Glue Data Quality — further reading on rulesets and evaluation runs; no claims in this post are drawn from it
- Data Quality Definition Language (DQDL) reference — further reading on the rule and analyzer syntax; no claims in this post are drawn from it
Comments