A real gap closed: TCP traffic to shared databases and on-premises endpoints is now visible in CloudWatch rather than only in logs you had to process. The thing to read before you build on it is the reporting criteria, because the alarm the announcement suggests does not work the way it reads.
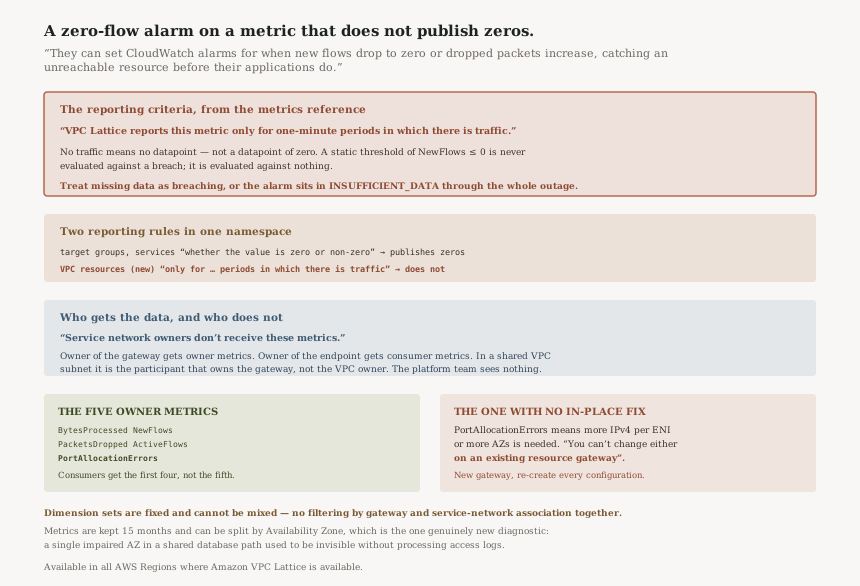
“VPC Lattice reports this metric only for one-minute periods in which there is traffic.”
Executive summary
“Amazon VPC Lattice now publishes Amazon CloudWatch metrics for VPC resources”. The split follows ownership: “Resource owners get metrics for resource gateways and resource configurations. Consumers get metrics for resource endpoints, service network endpoints, and service network VPC associations”. It is “available in all AWS Regions where Amazon VPC Lattice is available”.
The before-state is accurately described: “Previously, resource access logs were the primary way to see this traffic, but they required additional processing and provided limited real-time visibility”. Anyone who has tried to answer is the shared database reachable from this VPC right now from access logs knows this is an improvement.
Three things the announcement does not surface. The new metrics publish only in minutes that carry traffic, which breaks the zero-threshold alarm it recommends. Service network owners receive none of these metrics. And the one metric that warns you about a capacity limit is warning about a limit with no in-place fix.
What changed
Five metrics for resource owners, in the AWS/VpcLattice namespace:
BytesProcessed, PacketsDropped, NewFlows,
ActiveFlows and PortAllocationErrors. Consumers get the first four.
They are genuinely layer-4 signals rather than repackaged request metrics.
ActiveFlows is
“The number of flows currently established to your resources through the resource gateway,
including idle flows that are still tracked” — the idle clause matters for anything
using connection pools, because a pool holding open idle connections keeps this number up while doing
no work.
PacketsDropped on the owner side is
“The number of packets dropped by the resource gateway. Increasing values could indicate that
the resource is unhealthy or unreachable from the resource gateway”, and metrics are
published for all resource configuration types: single, group, child, ARN, and CIDR. Retention is 15
months.
Architecture
The alarm the announcement suggests, and why it does not fire
The announcement is specific about the use case: “They can set CloudWatch alarms for when new flows drop to zero or dropped packets increase, catching an unreachable resource before their applications do.”
The second half of that works. PacketsDropped increasing is a rising value, and a rising
value produces datapoints. The first half is the problem. When new flows drop to zero there is, by
definition, no traffic in that minute — and the metric is only published for minutes that have
traffic. There is no datapoint of zero. There is no datapoint.
A CloudWatch static threshold alarm evaluating NewFlows <= 0 therefore never sees a
breach. It sees missing data, and its missing-data treatment decides what happens next. On the default
treatment it goes to INSUFFICIENT_DATA and stays there for the duration of the outage,
which for an alarm configured to notify on ALARM means silence.
| What you want to detect | Naive alarm | What actually works |
|---|---|---|
| Resource stopped being reachable | NewFlows <= 0, default missing-data treatment |
Same threshold with missing data treated as breaching |
| Path degrading but up | PacketsDropped > 0 |
Works as written — a rising count publishes |
| Gateway running out of source ports | PortAllocationErrors > 0 |
Works, but the remedy is a new gateway (below) |
This is the same shape as the stopped-canary problem: an absent signal and a healthy signal are
different states, and an alarm that only notifies on ALARM treats them identically.
Missing data as breaching is the whole fix, and it costs one setting.
Two reporting rules in one namespace
What makes this genuinely easy to get wrong is that AWS/VpcLattice already contained
metrics that behave the other way. The target group and service metrics are documented as reported
“from the time the resource receives traffic, whether the value is zero or
non-zero” — they do publish zeros once traffic has ever been seen.
So an engineer who has previously built a zero-threshold alarm on a VPC Lattice service metric, and had it work, will build the same alarm on a VPC resource metric and get different behaviour from the same console, the same namespace and an almost identically worded metric description. Nothing warns you. The only tell is the reporting-criteria line in the reference.
Who receives the telemetry, and who does not
“These metrics are published only to the account that owns the resource gateway. If the resource gateway is in a shared VPC subnet, the participant account that owns the resource gateway receives these metrics, not the VPC owner. Service network owners don't receive these metrics.”
Three distinct statements, and the third is the one with organisational consequences. In most VPC Lattice designs the service network is owned by a central networking or platform team — that is the point of a service network. This launch gives that team nothing. Observability lands with the resource owner and the resource consumer, who are the application teams on either end.
That is defensible on data-minimisation grounds: the service network owner can see that an association exists without seeing the traffic volumes flowing through it. But if your operating model has the platform team running connectivity incidents, this telemetry is in the wrong accounts for that, and the fix is a cross-account metric strategy rather than a console tab.
The shared-VPC clause is a smaller trap with the same shape: in a shared-subnet design the VPC owner is often the networking team and the participant is the application team. The metrics follow the gateway, not the VPC.
The metric whose remedy is a migration
PortAllocationErrors is “The number of connections that the resource gateway
could not establish because it could not allocate a source port”, and the reference is
unusually direct about what to do:
“Increasing values usually mean that the resource gateway needs more IPv4 addresses per ENI
or more Availability Zones. You can't change either on an existing resource gateway,
so create a resource gateway with the settings you need and re-create your resource configurations on
it.”
This is the most valuable line in the whole launch, and it is not in the announcement. A new metric that tells you about a scaling limit is good. A new metric that tells you about a scaling limit whose only remedy is building a replacement gateway and re-creating every resource configuration on it is a planning input, not an alerting input.
Which means the right time to look at PortAllocationErrors is before it is non-zero. Put
it on a trend, not just a threshold — because by the time it alarms, the fix is a change window.
Dimension sets are fixed
“The metrics are available only for the following dimension sets. You can't combine
dimensions from different sets.” Each set is a single identifier, optionally paired with
AvailabilityZone. You cannot ask for traffic to one resource configuration from one
specific service network association, because those are separate sets.
The AvailabilityZone pairing is the genuinely new diagnostic capability here. Both
parties can “break metrics down by Availability Zone to isolate zonal issues or verify
connections after configuration changes”, and a single impaired AZ on the path to a shared
database is exactly the fault that used to require processing access logs to see.
Business value
The before-and-after is real. Shared-resource connectivity has been one of the harder things to observe in a VPC Lattice design, because the interesting traffic is TCP to something that belongs to another team, and the only record was a log that needed a pipeline. Near-real-time metrics with an AZ dimension turn a forensic exercise into a dashboard.
The consumer side is the bigger win. A team consuming a shared database through an endpoint previously had almost no first-party signal about that path; their own application errors were the signal. Now the path has its own telemetry, owned by them, independent of whether the resource owner shares anything.
Security considerations
The ownership split is a privacy boundary doing real work: the resource owner sees load on their resource and the consumer sees their own path, without either seeing the other's full picture, and the service network owner — who could otherwise observe every tenant's traffic volumes — sees none of it.
Flow counts are still a side channel. NewFlows and BytesProcessed per AZ on
a shared resource reveal something about a consumer's workload shape and schedule to the resource
owner. That is inherent to shared infrastructure, but it is worth knowing before publishing a
cross-account dashboard.
And the gap worth naming: because the service network owner receives nothing, security monitoring built on the assumption that the central team can observe service-network traffic needs a different design. Resource access logs remain the route for that.
Cost considerations
The announcement states no charge for the metrics and no Region restriction beyond VPC Lattice's own
footprint. These are vended metrics in an AWS namespace, so the cost that accrues is on what you do
with them — alarms, dashboards, and any GetMetricData polling.
The genuine saving is on the thing being replaced. If access-log processing existed only to answer reachability and volume questions, that pipeline — delivery, storage, and the queries over it — can potentially go away. Keep it where you need per-connection detail or an audit record; metrics are aggregates and cannot tell you which client.
Operational considerations
Set missing-data treatment deliberately on every alarm you build on these metrics. That is the single operational instruction worth taking from this post. A quiet resource and a healthy resource produce the same empty chart.
Expect the charts to be gappy by design rather than broken. A resource accessed on a batch schedule will have datapoints during the batch and nothing in between, and a dashboard built with the default visualisation will draw that as a line with holes in it. That is correct behaviour and someone will open a ticket about it.
Trend PortAllocationErrors rather than only alarming on it, since its remedy needs a
change window and a re-creation of resource configurations.
Tradeoffs
| Approach | What you get | What it costs |
|---|---|---|
| Metrics with missing-data-as-breaching | Near-real-time detection of an unreachable resource | Alarms on genuinely idle resources; needs a schedule-aware threshold or a longer evaluation period |
| Metrics on default missing-data treatment | Quiet dashboards, no false alarms | Silence during the exact outage you built the alarm for |
| Keep processing resource access logs | Per-connection detail, client identity, an audit record | The processing and latency the announcement describes |
| Central observability via the service network | One team sees everything | Not available — service network owners do not receive these metrics |
Implementation guidance
Start on the consumer side, where the signal is new and the ownership is unambiguous: an alarm per
resource endpoint on NewFlows with missing data treated as breaching, and a second on
PacketsDropped for degradation that is not a full outage.
On the owner side, chart BytesProcessed and ActiveFlows per resource
configuration to see which consumers actually drive load, remembering that idle pooled connections
inflate ActiveFlows without representing work.
Add the AvailabilityZone dimension to anything you expect to use during an incident. A
metric that is flat in aggregate and broken in one AZ is the case this launch newly lets you see, and
it is invisible without the dimension.
Best practices
- Treat missing data as breaching on any alarm meant to detect absence of traffic.
- Do not reuse a zero-threshold alarm pattern from target group or service metrics — those publish zeros, these do not.
- Trend
PortAllocationErrors; its remedy is a new resource gateway, not a setting. - Do not assume the platform team can see this; plan cross-account metric sharing if they run incidents.
- Keep access logs for anything needing client identity or per-connection evidence.
Who should adopt this and when
Immediately: anyone consuming shared databases, clusters or on-premises endpoints through VPC Lattice resource endpoints. This is first-party telemetry for a path you previously could not see, and it costs nothing to turn on because it is already publishing.
Immediately, with planning: resource gateway owners, who should look at
PortAllocationErrors now rather than when it alarms.
Not yet solved: central platform teams owning service networks. This launch does not give you this data, and no setting changes that.
Key takeaways
The capability is a real improvement over “resource access logs… required additional processing and provided limited real-time visibility”, with an AZ dimension that makes zonal faults visible for the first time.
The line to read before building: “VPC Lattice reports this metric only for one-minute periods in which there is traffic.” The announcement's own suggested alarm — new flows dropping to zero — needs missing data treated as breaching, or it never fires.
And two facts with no setting attached:
“Service network owners don't receive these metrics”, and on
PortAllocationErrors,
“You can't change either on an existing resource gateway”.
Official AWS references
- Amazon VPC Lattice now supports CloudWatch metrics for VPC resources — the announcement: that VPC Lattice now publishes CloudWatch metrics for VPC resources, the owner and consumer metric split, the previous reliance on resource access logs with their processing requirement and limited real-time visibility, the suggested alarms on new flows dropping to zero and dropped packets increasing, the port allocation error signal for IPv4 address exhaustion per network interface, the Availability Zone breakdown, and availability in all Regions where VPC Lattice is available
- CloudWatch metrics for Amazon VPC Lattice — the reporting criteria that VPC resource metrics are reported only for one-minute periods in which there is traffic, the contrasting target group and service criteria of reporting whether the value is zero or non-zero, that metrics are published only to the account owning the resource gateway with the shared-VPC participant clause and that service network owners do not receive them, the
BytesProcessed,PacketsDropped,NewFlows,ActiveFlowsandPortAllocationErrorsdefinitions including the idle-flow clause and the no-in-place-fix remedy, that dimension sets cannot be combined, the 15-month retention, and that metrics are published for all resource configuration types - Configuring how CloudWatch alarms treat missing data — further reading on the missing-data treatments this post recommends setting deliberately; no claims in this post are drawn from it
- Resource gateways — further reading on the gateway whose IPv4-per-ENI and Availability Zone settings are fixed at creation; no claims in this post are drawn from it
- Resource configurations — further reading on the configuration types the metrics cover; no claims in this post are drawn from it
Comments