CloudWatch PromQL alarms can now trigger Auto Scaling policies. The capability is narrower than it first reads, and the interesting part is not what it adds but what it transfers: with this path, the scaling alarm becomes yours, and so does its behaviour when the data stops.
“Target tracking is not currently a supported policy type for PromQL alarms.”
Executive summary
“Amazon CloudWatch alarms that use Prometheus Query Language (PromQL) can now trigger Amazon EC2 and Application Auto Scaling step and simple scaling policies.”
Two constraints come with it. Target tracking is excluded, and “The query must return a single series and compare it to a threshold.” The second is the one worth sitting with, because a PromQL alarm's distinguishing behaviour is precisely that it handles many series at once.
What you gain in exchange is ownership of the alarm. Target tracking does not let you have it — “Do not create, edit, or delete the CloudWatch alarms that are used with a target tracking scaling policy” — and that ownership is the whole story of this release.
What changed
Before, a PromQL alarm could notify. Now it can also act on EC2 Auto Scaling and Application Auto
Scaling step and simple scaling policies, configurable through the console, PutMetricAlarm,
the CLI, the SDKs or CloudFormation.
What a PromQL alarm normally does is worth restating, because the new constraint cuts across it: “The query selects metrics ingested through the CloudWatch OTLP endpoint, and all matching time series returned by the query are considered to be breaching”, and “The alarm evaluates the query at a regular interval and tracks each breaching time series independently as a contributor.”
So the native model is many contributors, each with its own state, aggregated into one alarm state: “The alarm is in ALARM state when at least one contributor has been breaching for longer than the pending period. The alarm returns to OK state when all contributors have recovered.” To drive scaling, you collapse that to one series. The feature works; it just works with the contributor model switched off.
Architecture
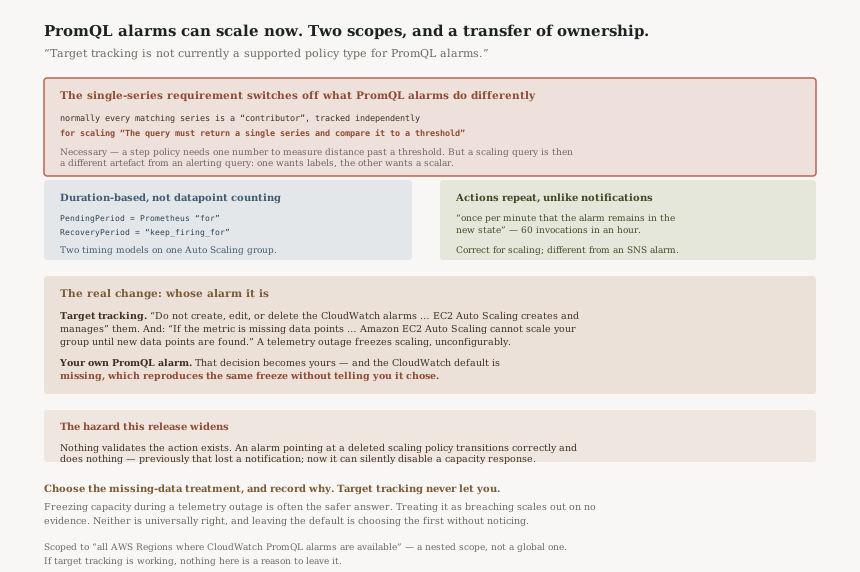
The single-series requirement, against the contributor model
| PromQL alarm, normally | PromQL alarm driving scaling | |
|---|---|---|
| Series handled | All matching series, each tracked independently | “must return a single series” |
| State logic | ALARM when any one contributor has breached past the pending period | One series compared to a threshold |
| What you learn | Which contributors are breaching, by attribute set | That the aggregate crossed a line |
This is not a defect, and for scaling it is arguably necessary — a step scaling policy needs one number to measure distance past a threshold, not a set of labelled series. But it means the PromQL expression you write for scaling is a different kind of expression from the one you would write for alerting, and a query that works well for one will usually need an aggregation wrapped around it for the other.
Duration-based timing, not datapoint counting
PromQL alarms do not use the M-out-of-N datapoint model. They use durations:
“PendingPeriod is the duration in seconds that a contributor must continuously
breach before the contributor transitions to ALARM state. This is equivalent to the Prometheus alert
rule's for duration”, and
“RecoveryPeriod is the duration in seconds that a contributor must stop breaching
before the contributor transitions back to OK state. This is equivalent to the Prometheus alert rule's
keep_firing_for duration”, with
“EvaluationInterval is how frequently, in seconds, the alarm evaluates the PromQL
query.”
For anyone arriving from Prometheus that is a welcome mapping, and it also means the tuning knobs for a scaling alarm are different here from every other CloudWatch alarm attached to the same Auto Scaling group. A fleet with both kinds has two mental models for how long before this reacts.
The ownership transfer, which is the real change
Target tracking keeps the alarm away from you on purpose: “Do not create, edit, or delete the CloudWatch alarms that are used with a target tracking scaling policy. Amazon EC2 Auto Scaling creates and manages the CloudWatch alarms that are associated with your target tracking scaling policies.”
That has a consequence most people meet only during an incident: “If the metric is missing data points, this causes the CloudWatch alarm state to change to INSUFFICIENT_DATA. When this happens, Amazon EC2 Auto Scaling cannot scale your group until new data points are found.”
So under target tracking, a telemetry outage freezes scaling, and you cannot configure your way out of
it because the alarm is not yours. Bring your own PromQL alarm and that decision becomes yours —
along with the responsibility for it, because the CloudWatch default is
“missing”, which sends an alarm whose data has stopped to
“INSUFFICIENT_DATA” rather than to ALARM. The default reproduces the target-tracking
behaviour; changing it is now possible and is a decision somebody has to make.
Auto Scaling actions repeat, unlike notifications
“An alarm invokes actions only when the alarm changes state. The exception is for alarms with Auto Scaling actions. For Auto Scaling actions, the alarm continues to invoke the action once per minute that the alarm remains in the new state.”
Sixty invocations an hour while the state holds. That is correct for scaling — continuous pressure while the condition persists — and it is a different contract from the one an SNS notification on the same alarm obeys. If you are attaching a scaling action to an alarm that previously only notified, the action semantics change under you.
Business value
The value is for teams who already run Prometheus-style instrumentation and ship it to CloudWatch over OTLP. Until now those metrics could alert but not scale, which meant maintaining a second, CloudWatch-native metric path purely so Auto Scaling had something to read. That duplication can go.
It also unlocks scaling on expressions that CloudWatch metric math handles awkwardly. PromQL is good at ratios and rates across labelled dimensions, and a scaling signal of the form error rate per healthy instance is more naturally written there, as long as it aggregates to one series at the end.
The cost side is unchanged: “Standard CloudWatch alarm pricing applies.”
Security considerations
Little changes directly, but one existing behaviour is worth repeating because this release widens its blast radius: “CloudWatch doesn't test or validate the actions that you specify, nor does it detect any Amazon EC2 Auto Scaling or Amazon SNS errors resulting from an attempt to invoke nonexistent actions.”
An alarm pointing at a deleted or renamed scaling policy will transition correctly and do nothing, with no error against the alarm. Previously that failure mode affected notifications; attaching scaling actions to the same mechanism means it can now silently disable a capacity response.
The alarm's own permissions are the other thing to keep narrow. An alarm that can invoke a scaling policy is an alarm that can change capacity, so the IAM path that lets someone create or edit alarms is now a path that can affect spend and availability.
Cost considerations
Standard alarm pricing, so the direct cost is the alarm itself. The indirect cost is the one to model: an alarm driving a step scaling policy changes capacity, and a mis-specified PromQL query that aggregates incorrectly will change it in the wrong direction or too far.
Worth noting that the excluded policy type is the one with the strongest cost-control reputation. Target tracking holds a utilisation target, which is what keeps a fleet near its efficient point. Step scaling moves by the distance past a threshold, which is more controllable and less self-correcting — AWS frames the trade honestly: “A target tracking scaling policy prioritizes availability during periods of fluctuating traffic levels by scaling in more gradually when traffic is decreasing. If you want greater control, a step scaling policy might be the better option.”
So this release gives you the more controllable policy types and not the more self-correcting one. For a team that wants to scale on a PromQL signal, that is a reasonable place to start; for a team currently on target tracking and happy with it, this is not a migration prompt.
Operational considerations
Decide the missing-data treatment explicitly. This is the decision target tracking never let you make. The default sends a data outage to INSUFFICIENT_DATA, which stops scaling; treating it as breaching would scale out blind. Neither is universally right, and leaving it on the default is choosing the first without noticing.
Two timing models now coexist. PromQL alarms use
PendingPeriod/RecoveryPeriod durations; metric alarms on the same group use
evaluation periods and datapoints. Document which is which, or the next person tuning responsiveness
will change the wrong knob.
Test the action path. Nothing validates that the scaling policy the alarm names still exists. Forcing the alarm into ALARM and confirming a scaling activity appears is the only proof.
For sparse metrics, AWS suggests metric math rather than a different treatment —
“If the metric is sparsely reported by design, metric math can be helpful. For example, to use
the most recent values, then use the FILL(m1,REPEAT) function where m1 is the
metric.” That advice is written for target tracking and the instinct carries over.
Tradeoffs
| Choice | What you gain | What it costs |
|---|---|---|
| PromQL alarm driving step scaling | Scale on OTLP-ingested metrics without a second metric path | Single series only, no target tracking, and the missing-data decision is yours |
| Target tracking, as today | Self-correcting toward a utilisation target, alarm managed for you | You cannot touch the alarm, and missing data freezes scaling |
| PromQL alarm for alerting only | Per-contributor tracking, Prometheus-style durations | No scaling action; a separate alarm needed for that |
| Treating missing data as breaching | A telemetry outage scales out rather than freezing | Scaling out on no evidence, which costs money and hides the outage |
Implementation guidance
Wrap the query in an aggregation and check it returns one series before attaching a scaling action. The requirement is explicit and a query that returns two series is not a scaling signal.
Set PendingPeriod against your instance warmup, not against your alerting
instincts. An alerting pending period is tuned to avoid paging on a blip; a scaling one is
tuned to avoid oscillation while capacity arrives. They are rarely the same number.
Choose the missing-data treatment and record why. For a scaling alarm, freezing capacity during a telemetry outage is often the safer default — which is what target tracking does — but it should be a decision rather than an inheritance.
Confirm Region availability before designing around it. “This feature is available in all AWS Regions where CloudWatch PromQL alarms are available” is a nested scope, not a global one.
If you need the contributor model and scaling, use two alarms. A PromQL alarm can be “a child alarm in a CloudWatch composite alarm's rule expression, the same as any other alarm type”, so per-contributor alerting and single-series scaling can coexist as separate objects reading the same telemetry.
Best practices
Treat the scaling alarm as production configuration under change control. It is now an object you own that can change capacity, which is a different class of thing from a notification alarm.
Keep alerting queries and scaling queries separate even when they read the same metric. One wants labels; the other wants a scalar.
Prove the path end to end once, and again after any change to the scaling policy's name or the alarm's action list, because nothing else will tell you it broke.
Remember that scaling actions repeat once a minute while the alarm holds state. An alarm that enters ALARM and stays there is not a single event.
Who should adopt this and when
Adopt now if you ship Prometheus-style metrics to CloudWatch over OTLP and have been maintaining a parallel CloudWatch metric purely so Auto Scaling has something to read. That duplication is the thing this removes.
Adopt now if your best scaling signal is a ratio or rate across labelled dimensions that metric math expresses awkwardly, and you can aggregate it to one series.
Stay where you are if target tracking is working. It is not supported here, it remains the more self-correcting option, and nothing in this release is a reason to leave it.
Wait if you are in a Region without CloudWatch PromQL alarms, or if the signal you want to scale on genuinely needs per-contributor state.
Key takeaways
Two scopes are stated plainly in the announcement and both matter: target tracking is excluded, and the query must return a single series. The second one switches off the contributor tracking that distinguishes PromQL alarms, so a scaling query is a different artefact from an alerting query.
The change worth planning around is ownership. Target tracking's alarm is AWS's, you are told not to touch it, and missing data stops scaling. A PromQL alarm is yours, which means the missing-data behaviour is a decision you now make — and the CloudWatch default reproduces the old behaviour without saying so.
And the unchanged hazard underneath: nothing validates that the scaling policy your alarm names still exists, and nothing reports the failure when it doesn't.
Official AWS references
- CloudWatch PromQL alarms can trigger Auto Scaling policies — the announcement: EC2 and Application Auto Scaling step and simple policies, the exclusion of target tracking, the single-series requirement, the nested Region scope and standard alarm pricing
- PromQL alarms — the OTLP ingestion path, all matching series treated as breaching and tracked independently as contributors, the alarm-level state logic, the
PendingPeriod,RecoveryPeriodandEvaluationIntervalparameters and their Prometheus equivalents, and composite alarm compatibility - Target tracking scaling policies for Amazon EC2 Auto Scaling — that EC2 Auto Scaling creates and manages the alarms and you should not touch them, that missing data sends the alarm to INSUFFICIENT_DATA and stops scaling, the availability-versus-control trade against step scaling, and the
FILL(m1,REPEAT)suggestion for sparse metrics - Using Amazon CloudWatch alarms — that Auto Scaling actions repeat once per minute while the state holds, unlike other actions which fire only on transition, and that CloudWatch neither validates alarm actions nor detects errors invoking nonexistent ones
- Configuring how CloudWatch alarms treat missing data — that the default treatment is
missing, which sends an alarm with no data to INSUFFICIENT_DATA
Comments