Business Challenge
#76 deferred to this instrument twice: once for continuous visibility into long-lived flows, once for the protocols firewall logs ignore. So here it is. VPC Flow Logs samples packets in your Virtual Private Cloud (VPC) network to generate flow logs, and flow logs are aggregated by IP connection (5-tuple).
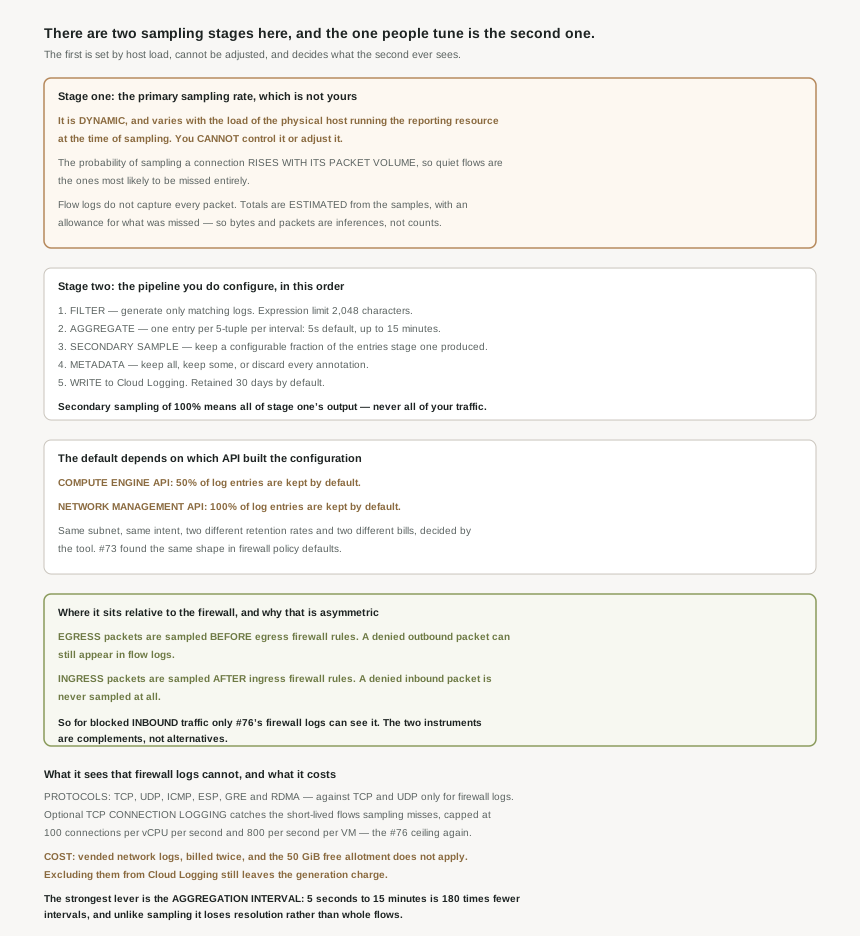
The word doing the damage is sampling, because there are two sampling stages and the one everybody configures is the second. The first is not a setting at all. Everything else in this post — what a byte count means, what a zero means, what the bill looks like — follows from that.
You are capturing everything that survived a stage you do not control. VPC Flow Logs samples packets using a primary sampling rate, and that rate is dynamic and varies depending on the load of the physical host running the reporting resource at the time of sampling. Then, unambiguously: you can't control the primary flow log sampling process or adjust the primary sampling rate. The configurable rate is a second sampling process, and the secondary sampling is performed on the flow logs generated by the primary flow log sampling process.
Correct approachRead "secondary sampling 100%" as "I am discarding none of what I was given", not as "I am seeing all my traffic". The documentation says it plainly: VPC Flow Logs doesn't capture every packet. Instead, it estimates total traffic based on the sampled packets, accounting for missed packets. Every byte and packet figure in a flow log is an estimate produced by that correction.
The primary stage is biased, and it is biased against exactly the flows an investigation cares about: the probability of sampling any single IP connection increases with the volume of packets. A chatty backup job is near-certain to appear; a single short connection may never be sampled at all. Google acknowledges the gap and offers a separate mechanism for it, because the primary packet sampling can miss short-lived or low-volume TCP connections.
Correct approachFor questions of the form "did this host ever talk to that one", turn on TCP connection logging rather than raising the sampling rate, because the sampling rate you can raise is not the one that dropped the flow. And do not use flow-log absence as evidence in a security finding without saying which mechanisms were enabled.
In one direction only, and the useful direction is the missing one. Egress packets are sampled before egress firewall rules, so even if an egress firewall rule denies outbound packets, those packets can be sampled by VPC Flow Logs. But ingress packets are sampled after ingress firewall rules, and therefore if an ingress firewall rule denies inbound packets, those packets aren't sampled by VPC Flow Logs.
Correct approachFor blocked inbound traffic, #76's firewall rules logging is the only instrument that sees it — which is also the one that charges per dropped 5-tuple every five seconds. The two are complements, not alternatives, and an investigation into inbound scanning needs the firewall log specifically.
Architecture
One pipeline, two sampling stages, five configurable steps, and two charges.
The pipeline, in order
After the primary sampling you cannot touch, five steps run, and the order matters because each one shrinks the input to the next. Filtering first — you can specify that only matching logs are generated, with an expression whose limit of 2,048 characters is the practical ceiling on how precise that targeting gets. Then aggregation: all packets collected for a given IP connection within the aggregation interval are aggregated into a single flow log entry. Then the secondary sampling. Then metadata, where annotations can be kept entirely, kept selectively, or discarded. Then the write to Cloud Logging, where logs are stored in Logging for 30 days by default.
Filtering being first is the useful detail. A filter prevents generation rather than discarding after the fact, so it is the only control that reduces volume without degrading the records that remain. Sampling and metadata exclusion both pay for their savings in fidelity; a filter pays in scope, which is a choice you can reason about.
The default depends on which API created the configuration
This is the #73 pattern again, in a different product. For configurations created with the Compute Engine API, 50% of log entries are kept by default, while for configurations created with the Network Management API, 100% of log entries are kept by default. The Compute Engine path spells it out in its own flag documentation: secondary flow sampling can be set from 0.0 (no sampling) to 1.0 (all logs). Default is 0.5.
So two engineers enabling flow logs on the same subnet with the same intent produce configurations that differ by a factor of two in both completeness and cost, decided by which API their tooling happened to call. Nothing in the resulting configuration announces which default it inherited; you have to look at the value. The aggregation interval at least agrees across both paths — INTERVAL_5_SEC is the default either way.
The hierarchical firewall policy divergence changed which rules existed, and you could see the difference by listing the rules. This divergence changes a number that looks deliberate whichever value it holds. A configuration showing 0.5 is indistinguishable from one where somebody chose 0.5, so there is no artifact to audit — only a convention to enforce. Pin the sampling rate explicitly in whatever provisions these configurations, so the value is a decision rather than an inheritance.
Where it can be switched on, and who pays
The scopes nest: organization, VPC network, subnet, and individually for VLAN attachments and Cloud VPN tunnels. The organization level is the blunt one — an organization-level VPC Flow Logs configuration enables flow logs for all subnets, VLAN attachments, and Cloud VPN tunnels in all VPC networks in the organization.
Billing follows the reporting resource rather than the configuration. VPC Flow Logs charges are billed to the Google Cloud project containing the resource that reports flow logs, and crucially if VPC Flow Logs is enabled at the organization level, each project is billed separately. So an organization-wide enablement is a decision made centrally and paid for by every project individually, which is worth saying out loud before somebody makes it.
Shared VPC resolves the other way from #76's firewall logs, which is a genuine inconsistency to hold in mind. VPC Flow Logs writes logs to the project of the reporting VPC network, and for resources in Shared VPC networks, logs are reported in the host project. Firewall log records carry the service project in their instance details and the host project in their VPC details; flow logs land wholly in the host project. Two logging products, one Shared VPC, two answers about whose project the data is in.
A multi-interface VM needs enabling more than once
Two coverage gaps are easy to create without noticing. For VMs with several NICs, in each VPC, you need to enable VPC Flow Logs for each subnet that contains a network interface — so a dual-homed VM logs only the halves of its traffic whose subnets are enabled. And for container traffic, to log flows between Pods on the same Google Kubernetes Engine (GKE) node, you must enable intranode visibility for the cluster. Without it, same-node Pod-to-Pod traffic is invisible, which is the fourth time in this block that GKE Pod networking has needed a separate switch.
One scope simply does not apply: VPC Flow Logs isn't supported for subnets with purpose INTERNAL_HTTPS_LOAD_BALANCER, because proxy-only subnets hold no instances. And, as with #76, VPC Flow Logs works with VPC networks, not legacy networks.
Why This Architecture Holds Up
The record repeats #76's base-versus-metadata split, and then adds a sentence that changes how much weight the metadata can carry.
Log records contain base fields, which are the core fields of every log record, and metadata fields that add additional information, and metadata fields may be omitted to save storage costs. So far, identical to firewall logging. Then: the values for metadata fields aren't based on the data plane path; they are approximations and might be missing or incorrect. And by contrast, unlike metadata fields, the values for base fields are taken directly from packet headers.
That is an unusually direct admission, and it should change what you build on. The 5-tuple, the reporter, the timestamps and the estimated counts come from the packets. The instance names, the GKE details, the geographic region of an external peer, the Google service identification — all of that is annotation applied alongside, and Google says it may be wrong. Dashboards keyed on metadata are convenient; evidence keyed on metadata is not evidence.
What a byte count is, and what it is not
Two qualifiers sit on the volume fields and both matter. First, estimation: the field is the estimated number of user payload bytes sent from the source to the destination, and likewise the estimated number of packets sent from the source to the destination. Second, scope: it is user payload, so headers are excluded, and for packets with no user payload, the value is zero.
Put those together and a flow consisting entirely of handshakes, keepalives and ACKs reports zero bytes while being a real, active connection. If you alert on "flows with zero bytes", you will find TCP working correctly. And because the counts are estimates scaled up from samples, flow logs are the wrong instrument for reconciling against a bandwidth bill — they are sized to tell you proportions and top talkers, not totals.
There is one more counting trap, and it is a good one. Records for dropped traffic carry a field that indicates whether the dropped traffic is included ( INCLUDED ) or excluded ( EXCLUDED ) from the bytes_sent and packets_sent fields that are reported for the flow by the same reporter. So whether a dropped byte has already been counted in the flow's sent total varies per record, and a naive sum over both can double count. The drop fields are populated only for log records that capture packet drops, so the two kinds of record have to be handled separately rather than added.
Flow logs carry latency, which nothing else in this block has offered: round-trip time (RTT) in milliseconds as measured during the aggregation interval, with the measurement being the time between sending a SEQ and receiving the corresponding ACK. It is narrow — measured only for TCP traffic, populated for VMs and serverless endpoints, and absent for VLAN attachments, Cloud VPN tunnels and dropped traffic. But within that scope it turns flow logs from an accounting tool into a performance one, and it is the strongest reason to keep them on for a latency-sensitive service.
TCP connection logging: the answer to the sampling bias
Since the primary stage under-samples quiet flows, there is an opt-in that does not sample at all. TCP connection logging captures all outbound TCP connection attempts and all acknowledged inbound TCP connections. Mechanically it watches the handshake: for outbound connections, VPC Flow Logs captures the initial SYN packet, and for inbound connections, VPC Flow Logs captures the SYN-ACK packet that is sent in response to a received SYN packet.
It has its own ceiling, and it is a familiar number: up to 100 connections per vCPU per second (maximum 800 connections per second per VM) are logged, and connections that exceed these limits might not be logged. One hundred per vCPU caps out at eight vCPUs, giving 800 per second — precisely the figure #76 derived for firewall connection logging, where 4,000 per five-second interval is the same 800 per second. Two independent logging subsystems, the same per-VM ceiling, reached by different arithmetic.
And it is not exempt from the rest of the pipeline. The secondary flow log sampling setting applies to log entries for connection events, so a configuration left at the Compute Engine default of 0.5 discards half of them. The feature exists to stop you missing connections, and the default sampling rate will then throw away half of what it caught. If you enable connection logging for completeness, set the secondary rate to 1.0 in the same change.
The integration with aggregation is sensible: a connection event merges into the flow entry when data packets for the same 5-tuple are sampled in the same interval, and if a connection event occurs but no subsequent data packets are sampled during that aggregation interval, VPC Flow Logs generates a separate log entry for the connection event. Which is the whole point — the connection you would otherwise never have heard about gets its own record.
The protocol range, and why that matters after #76
This is where flow logs are unambiguously the broader instrument. VPC Flow Logs samples TCP, UDP, ICMP, ESP, GRE, and RDMA flows, against firewall rules logging's TCP and UDP only. So the ICMP and ESP traffic that is structurally invisible to #76's logs — and therefore to #75's insights — is visible here. One asymmetry inside that list: for RDMA over Converged Ethernet (RoCE), only outbound flows are sampled.
And the cost of running it is not performance: VPC Flow Logs introduces no delay or performance penalty when enabled. That is a stronger statement than anything #76 made about firewall logging, and it means the decision here is purely about money and noise.
The money, and the lever worth pulling
The pricing is the same structure #76 established, which is the point — these are the same vended logs. Vended logs include VPC Flow Logs, Firewall Rules Logging, and Cloud NAT logs, Network Vended Logs generate charges at 0 gibibyte to 10,240 gibibyte $0.25 falling to 51,200 gibibyte and above $0.05, and storage is billed separately at $0.25/GiB for streaming network telemetry logs into log bucket storage. The first 50 GiB/project/month allotment belongs to the row that applies except for vended network logs, so it does not help here either. First tier all in is $0.50 per GiB, and if you send and then exclude your logs from Cloud Logging, the Network Telemetry charges apply.
Which leaves volume, and here flow logs have a control firewall logs do not: the aggregation interval. This time interval can be 5 seconds (default), 30 seconds, 1 minute, 5 minutes, 10 minutes, or 15 minutes. Moving from the 5-second default to 15 minutes is 180 times fewer intervals per flow, and it is the only lever in this post that costs you resolution rather than records. Sampling throws away whole flows; metadata exclusion throws away context; a longer interval keeps every flow and every byte estimate, and merely tells you about them less often.
That makes the tuning order clear. Filter first, because it is free of fidelity cost within the scope you chose. Lengthen the aggregation interval second, because it loses the least. Drop metadata third, accepting that you lose the annotations that were approximate anyway. Reduce the secondary sampling rate last, because that is the one that makes absence ambiguous — and absence has already cost this block three posts' worth of false confidence.
Key Architecture Decisions
| Situation | Decision | Because |
|---|---|---|
| Needing to know whether two hosts ever communicated | Enable TCP connection logging, and set secondary sampling to 1.0 | Primary sampling misses short-lived and low-volume connections, and the secondary rate also applies to connection events. |
| Investigating blocked inbound traffic | Firewall rules logging, not flow logs | Ingress packets are sampled after ingress rules, so denied inbound packets are never sampled. |
| Investigating blocked outbound traffic | Flow logs work | Egress packets are sampled before egress rules. |
| Needing ICMP, ESP or GRE visibility | Flow logs | Firewall rules logging records only TCP and UDP. |
| Provisioning flow logs as code | Set the sampling rate explicitly, always | The default is 50% via the Compute Engine API and 100% via the Network Management API. |
| Cutting log volume | Filter, then lengthen the interval, then drop metadata, then sample | Only sampling makes absence ambiguous; a longer interval keeps every flow. |
| Reconciling flow logs against a bandwidth bill | Do not | Byte and packet counts are estimates of user payload scaled from samples. |
| Alerting on flows reporting zero bytes | Do not | Packets with no user payload count as zero, so healthy handshakes qualify. |
| Summing bytes across flow and drop records | Check throughput_inclusion per record |
Dropped bytes may already be included in the flow's sent totals. |
| Building evidence on instance names or geography | Treat it as indicative, and corroborate from base fields | Metadata values are approximations and might be missing or incorrect. |
| Latency investigation on a TCP service | Flow logs are a real option | They carry measured RTT, for TCP on VMs and serverless endpoints only. |
| A VM with several network interfaces | Enable per subnet, in each VPC | Coverage is per subnet, not per VM. |
| Pod-to-Pod traffic on one GKE node | Enable intranode visibility as well | Same-node Pod flows are otherwise not logged. |
| Enabling at the organization level | Expect every project to be billed separately | Charges follow the reporting resource, not the configuration. |
The one to look at today
Read the secondary sampling rate on every flow logs configuration you have, and note which API created each one. A value of 0.5 is almost certainly inherited rather than chosen, and it means half your flow log entries were discarded after a sampling stage that had already discarded an unknown fraction. Then decide the value deliberately, once, and set it explicitly everywhere — including on any configuration where you have enabled TCP connection logging, because that feature's whole purpose is defeated by a 0.5 it did not ask for.
Closing Thought
Three posts in a row have now turned on the same distinction, and this one states it most clearly: there is a difference between a measurement and an estimate, and cloud observability products are mostly the second while being read as the first. Firewall logs are capped and best-effort. Firewall Insights is bounded by whatever logging existed. Flow logs sample twice, estimate the totals, and annotate the result with fields the documentation says may be incorrect. None of that is a defect — packet-level truth at this scale would be unaffordable, and Google says so by pointing at Packet Mirroring for the cases that need it. The defect is reading an estimate as a count.
What I will keep from this one is the direction of the firewall asymmetry. Flow logs see outbound traffic you blocked and never see inbound traffic you blocked, which is precisely backwards from what you want during an incident. It is a consequence of where in the data path the sampling happens, it is documented in two sentences, and it would be almost impossible to infer from using the product. Seventeen posts into this block, the lesson keeps being the same: the instrument's position in the pipeline determines what it can possibly know, and that position is rarely visible from the dashboard built on top of it.
#78 reaches the instrument this post pointed at for the cases sampling cannot serve: Packet Mirroring — full packet capture, what it costs, and what it does to the traffic it copies.
Official Google Cloud Reference
- VPC Flow Logs overview
- About VPC Flow Logs records
- Configure VPC Flow Logs
- VPC network pricing
- VPC quotas and limits
- Google Cloud Observability pricing
- About traffic flows
- Access VPC Flow Logs
- Organization policy constraints for VPC Flow Logs
- Firewall policy rules logging overview
- Packet Mirroring overview
- Configure intranode visibility
Comments