📋 In This Post
- Lab Overview
- Cloud Services and Concepts
- Architecture and Workflow
- Prerequisites
- Implementation
- Validation and Evidence
- Security and Cost
- Troubleshooting and Lessons
- Cleanup and Key Takeaways
Lab Overview
The problem. A SIEM rule is code, and it ships like code — reviewed, merged, deployed. Then it is never tested. A scheduled analytics rule with a typo in a column name deploys perfectly. So does one whose query window is shorter than the ingestion delay it has to span. Both report healthy forever, and a detector that never fires looks exactly like an environment nobody is attacking.
The objective. Declare two Sentinel analytics rules in Terraform, then prove the pipeline end to end by generating a real attack-shaped event and watching it become an incident — while a second rule, pointed at something that did not happen, stays silent.
The outcome. Seven resources, eight validation checks, 13 alerts grouped into 3 incidents, zero false positives from the negative control, and a measured cost of effectively nothing.
Cloud Services and Concepts
| Service | Purpose here | What it is |
|---|---|---|
| Microsoft Sentinel | Evaluates the two detection rules and raises incidents | A SIEM that is enabled on a Log Analytics workspace rather than deployed as its own thing. The workspace holds the data; Sentinel adds detection, incidents and automation on top. |
| Log Analytics workspace | Stores the Activity log the rules query | The table store and query engine behind Azure Monitor. Sentinel has no storage of its own — this is it. |
| Azure Activity log | The only signal in this lab, and it is free | The subscription's control-plane record: who created, changed or deleted what. It lands in the AzureActivity table. |
| Diagnostic setting | Forwards the Activity log into the workspace | The routing rule that says "send these log categories from this scope to that destination". Attached to the subscription, not to a resource. |
| Scheduled analytics rule | The detection itself — a KQL query on a timer | A saved query, a frequency, a lookback window and a threshold. When the query returns more rows than the threshold, it raises an alert and opens an incident. |
Alert versus incident. Worth holding before the numbers later make no sense. An alert is one firing of one rule. An incident is the case an analyst works. Sentinel's grouping decides how many alerts become one incident, and that ratio is the thing this lab ends up measuring.
Architecture and Workflow
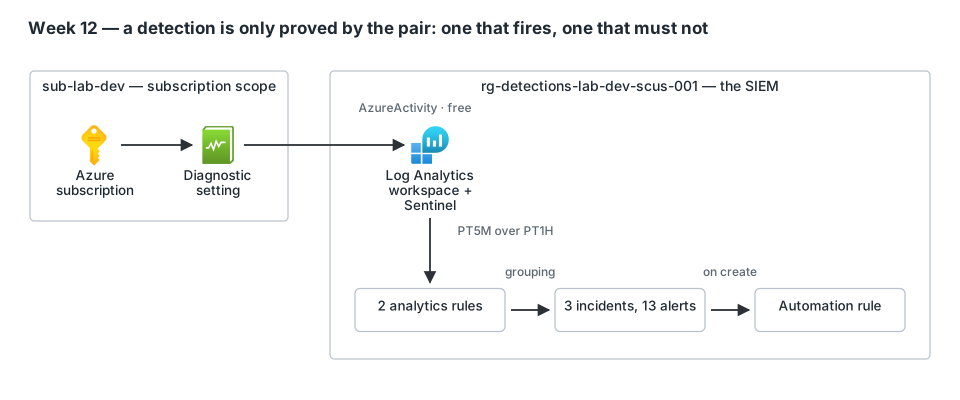
- A diagnostic setting on the subscription forwards the Administrative, Policy and Security Activity categories into the workspace.
- Enabling Sentinel on that workspace starts the 31-day free trial and turns the table store into a SIEM.
- Two analytics rules query
AzureActivityevery five minutes, each looking back one hour. - A role assignment is created deliberately. The positive control matches it and raises an alert.
- Incident grouping collapses repeated alerts for the same event into one incident instead of one per run.
- An automation rule labels each new incident the moment it is created.
- The negative control — policy assignment deletion — matches nothing, and must report zero.
Three design decisions worth stating.
The lookback is twelve times the frequency, on purpose. Activity records reach a workspace minutes after the operation, and that delay is not a documented constant. A rule whose window equals its frequency inspects five minutes that have probably not been filled yet, finds nothing, and reports healthy forever. A one-hour window over a five-minute cadence costs duplicate evaluation to buy immunity from a delay nobody controls.
No playbook. The obvious way to automate incident handling is a playbook, which is a Logic App — and Microsoft documents that automation charges are not waived by the Sentinel trial. An automation rule does what this lab needs, costs nothing, and keeps a zero-cost week honestly zero.
The negative control is not padding. It is half the experiment.
Prerequisites
- An Azure subscription where you hold Owner or User Access Administrator — the test creates a role assignment.
- Four resource providers registered:
Microsoft.OperationalInsights,Microsoft.Insights,Microsoft.SecurityInsightsandMicrosoft.OperationsManagement. The fourth is the one that catches people out. - Terraform ≥ 1.10,
hashicorp/azurerm~> 5.2. - Region:
southcentralus. Nothing here is region-specific. - No cross-week dependency. Week 08 built a Log Analytics workspace for cost design; this week builds its own, because the Sentinel free trial is granted per workspace.
Implementation
Step 1 — Price it before building it
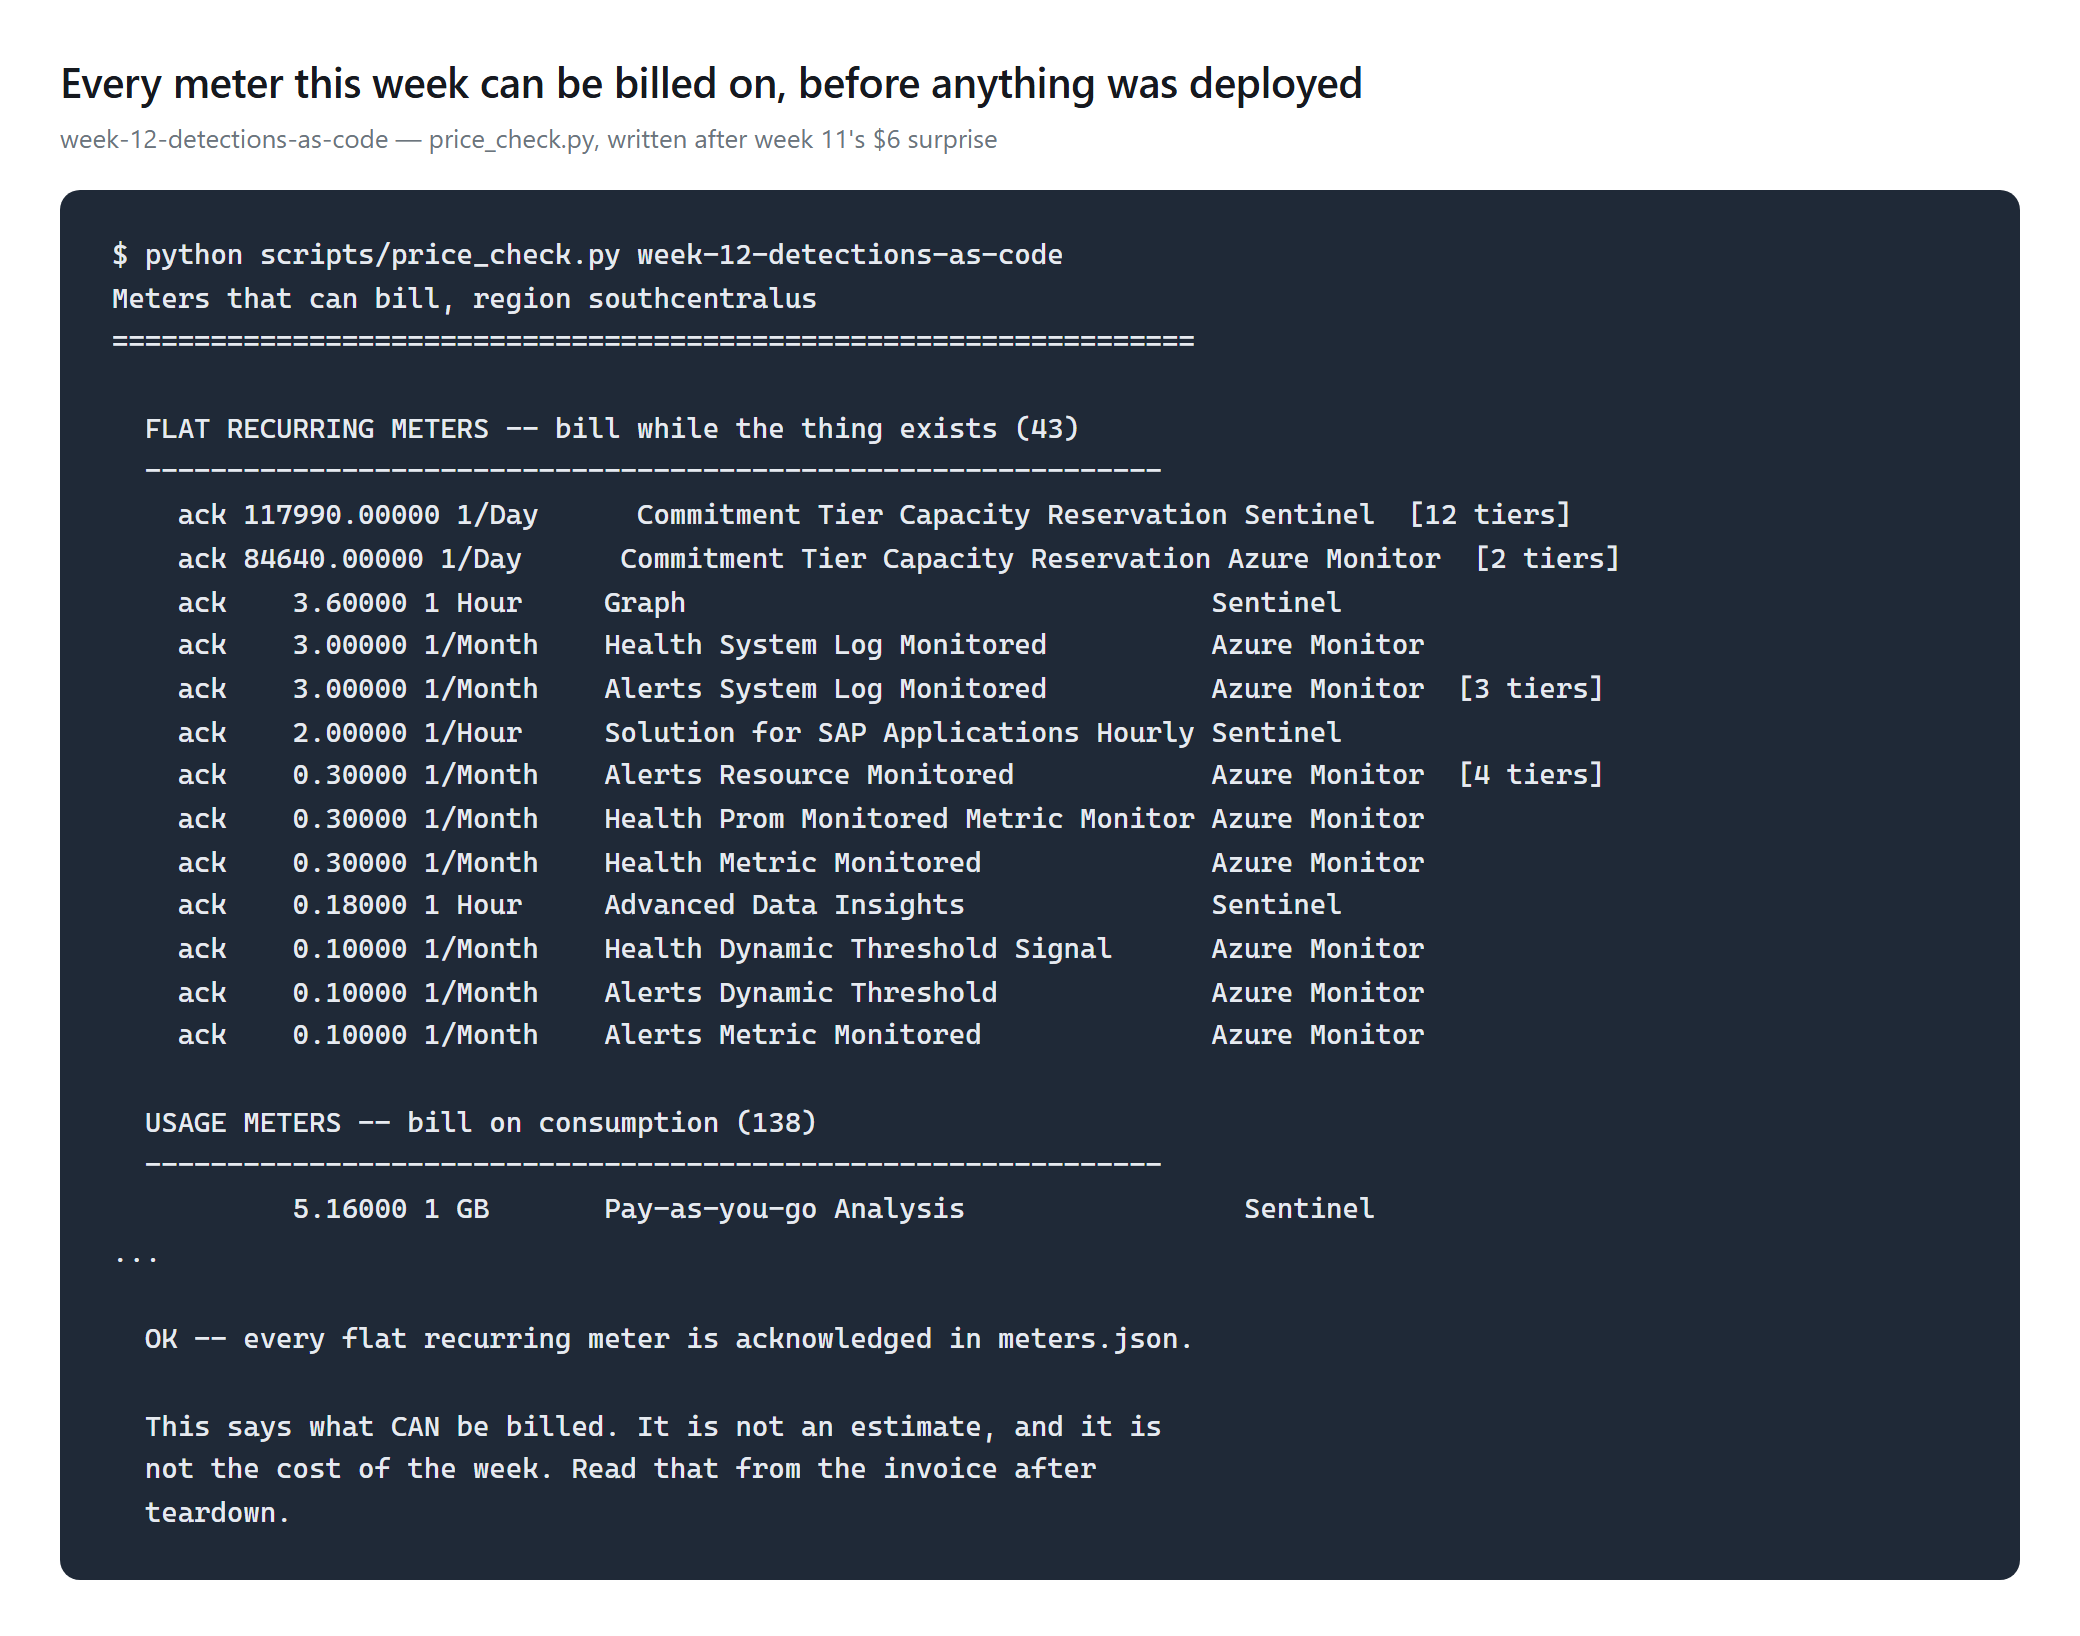
Why. Week 11 of this lab shipped a cost note that never mentioned Managed Grafana's flat $6/user/month meter. It was in the price API the whole time. The fix is not "read more carefully" — it is a gate.
Action.
python scripts/price_check.py week-12-detections-as-code. It
enumerates every meter the week's services can bill on, separates the
flat recurring ones — those that charge while a thing merely
exists — and refuses to pass until each is acknowledged in a committed
meters.json with a written reason.
Step 2 — The workspace, and Sentinel on top of it
Why. These are two objects, not one, and the distinction has a teardown consequence later.
resource "azurerm_sentinel_log_analytics_workspace_onboarding" "detections" {
  workspace_id = azurerm_log_analytics_workspace.detections.id
}
Validation. Ask the SecurityInsights API for the onboarding state rather than inferring it — a workspace without Sentinel looks identical from every other angle. Full source: main.tf.
Step 3 — The signal
Why. Sentinel's dedicated Azure Activity connector is
gone. The legacy forwarding solution was retired on 30 September
2026; the current path is an ordinary subscription-scope diagnostic
setting. The provider still ships
azurerm_sentinel_data_connector_* resources, and they are the
wrong answer now.
Action. One
azurerm_monitor_diagnostic_setting
targeting the subscription id.
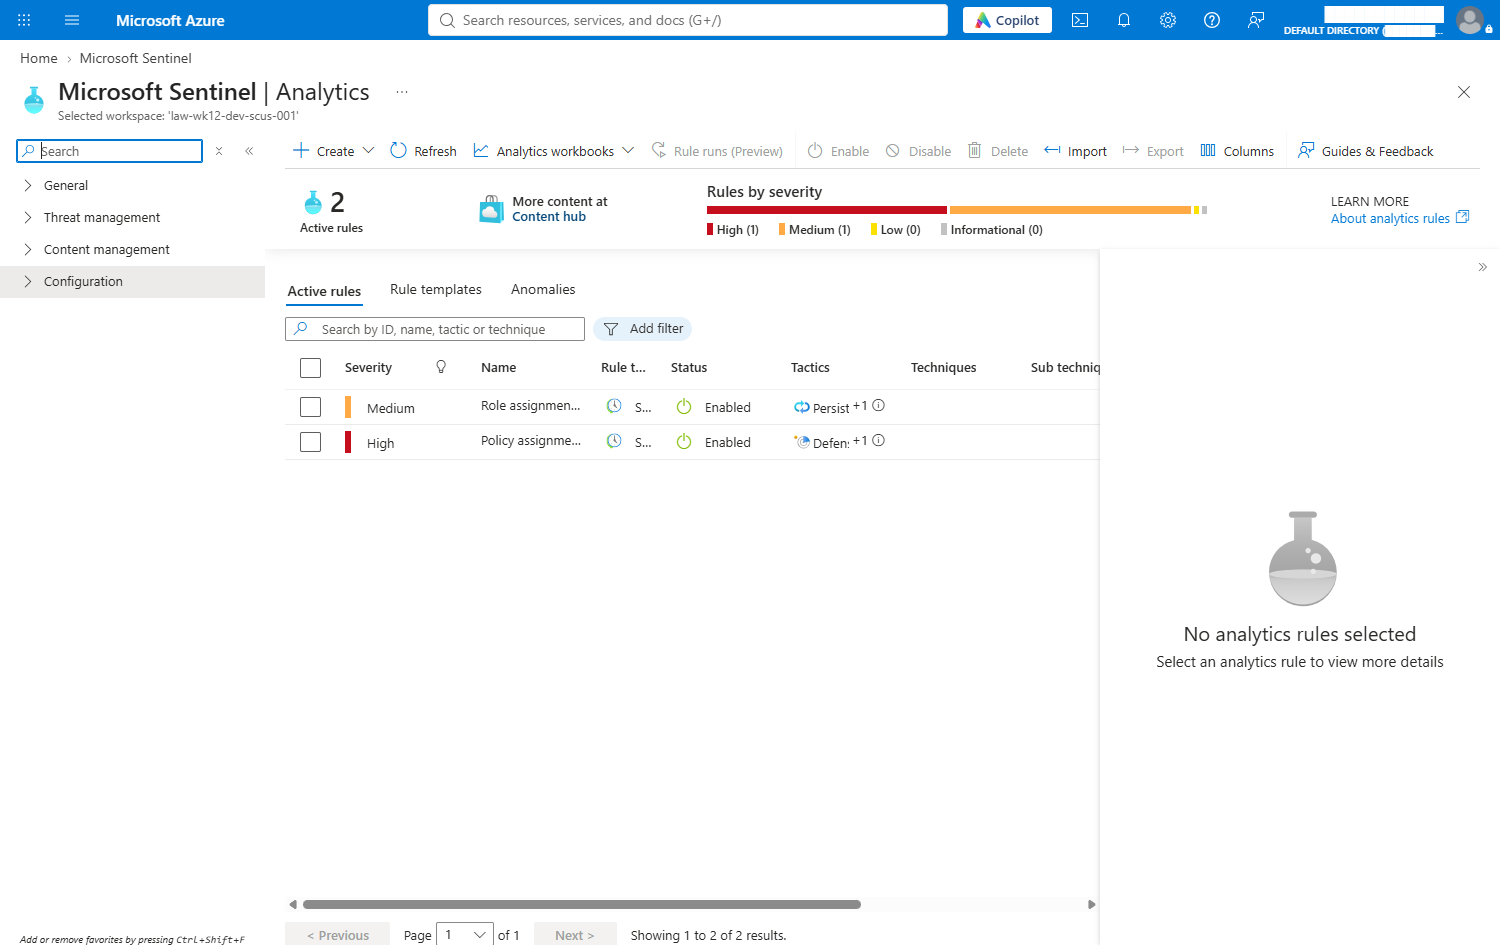
Step 4 — The matched pair
AzureActivity
| where OperationNameValue =~ "MICROSOFT.AUTHORIZATION/ROLEASSIGNMENTS/WRITE"
| where ActivityStatusValue =~ "Success"
The second rule is identical in shape and points at
POLICYASSIGNMENTS/DELETE — removing a guardrail, which is
quieter than violating one. Both map the caller and source IP as entities, so
an incident arrives with something to pivot on.
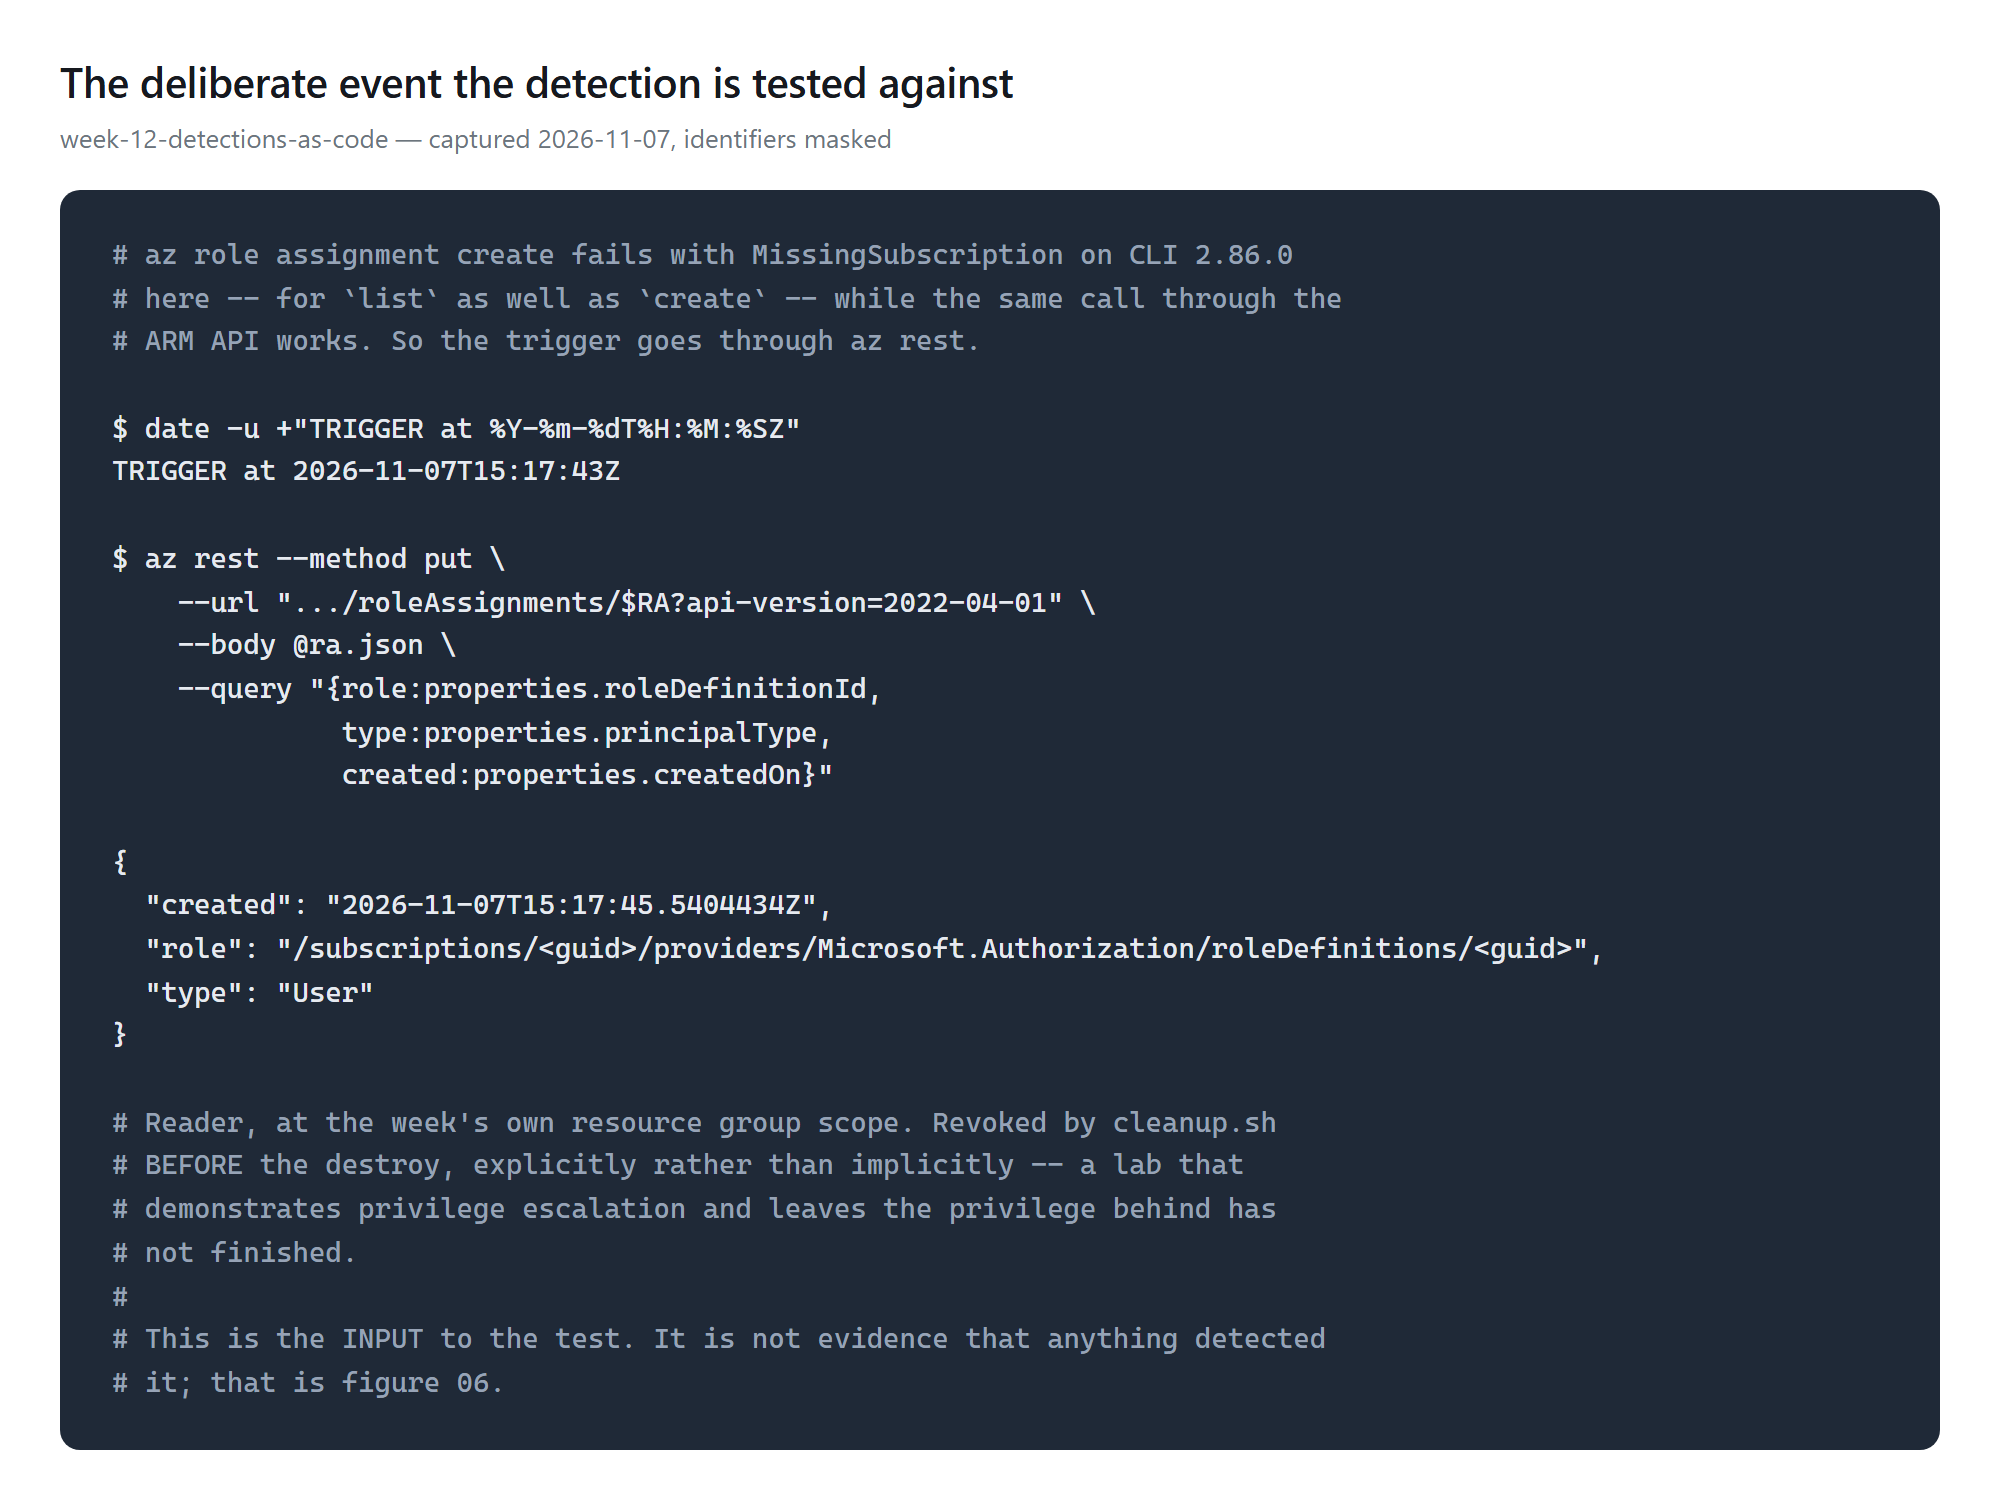
Step 5 — Attack it
Validation and Evidence
| Test | Expected | Actual | Status |
|---|---|---|---|
| Workspace exists | present | law-wk12-dev-scus-001 | PASS |
| Sentinel enabled on it | onboarding state present | present | PASS |
| Both detections enabled | 2 enabled | 2 enabled | PASS |
| Activity log reached the workspace | > 0 rows | 3 role-assignment rows | PASS |
| Positive control fired | ≥ 1 incident | 3 incidents, 13 alerts | PASS |
| Negative control silent | exactly 0 | 0 | PASS |
| Automation rule labelled it | 3 labels | 3 labels | PASS |
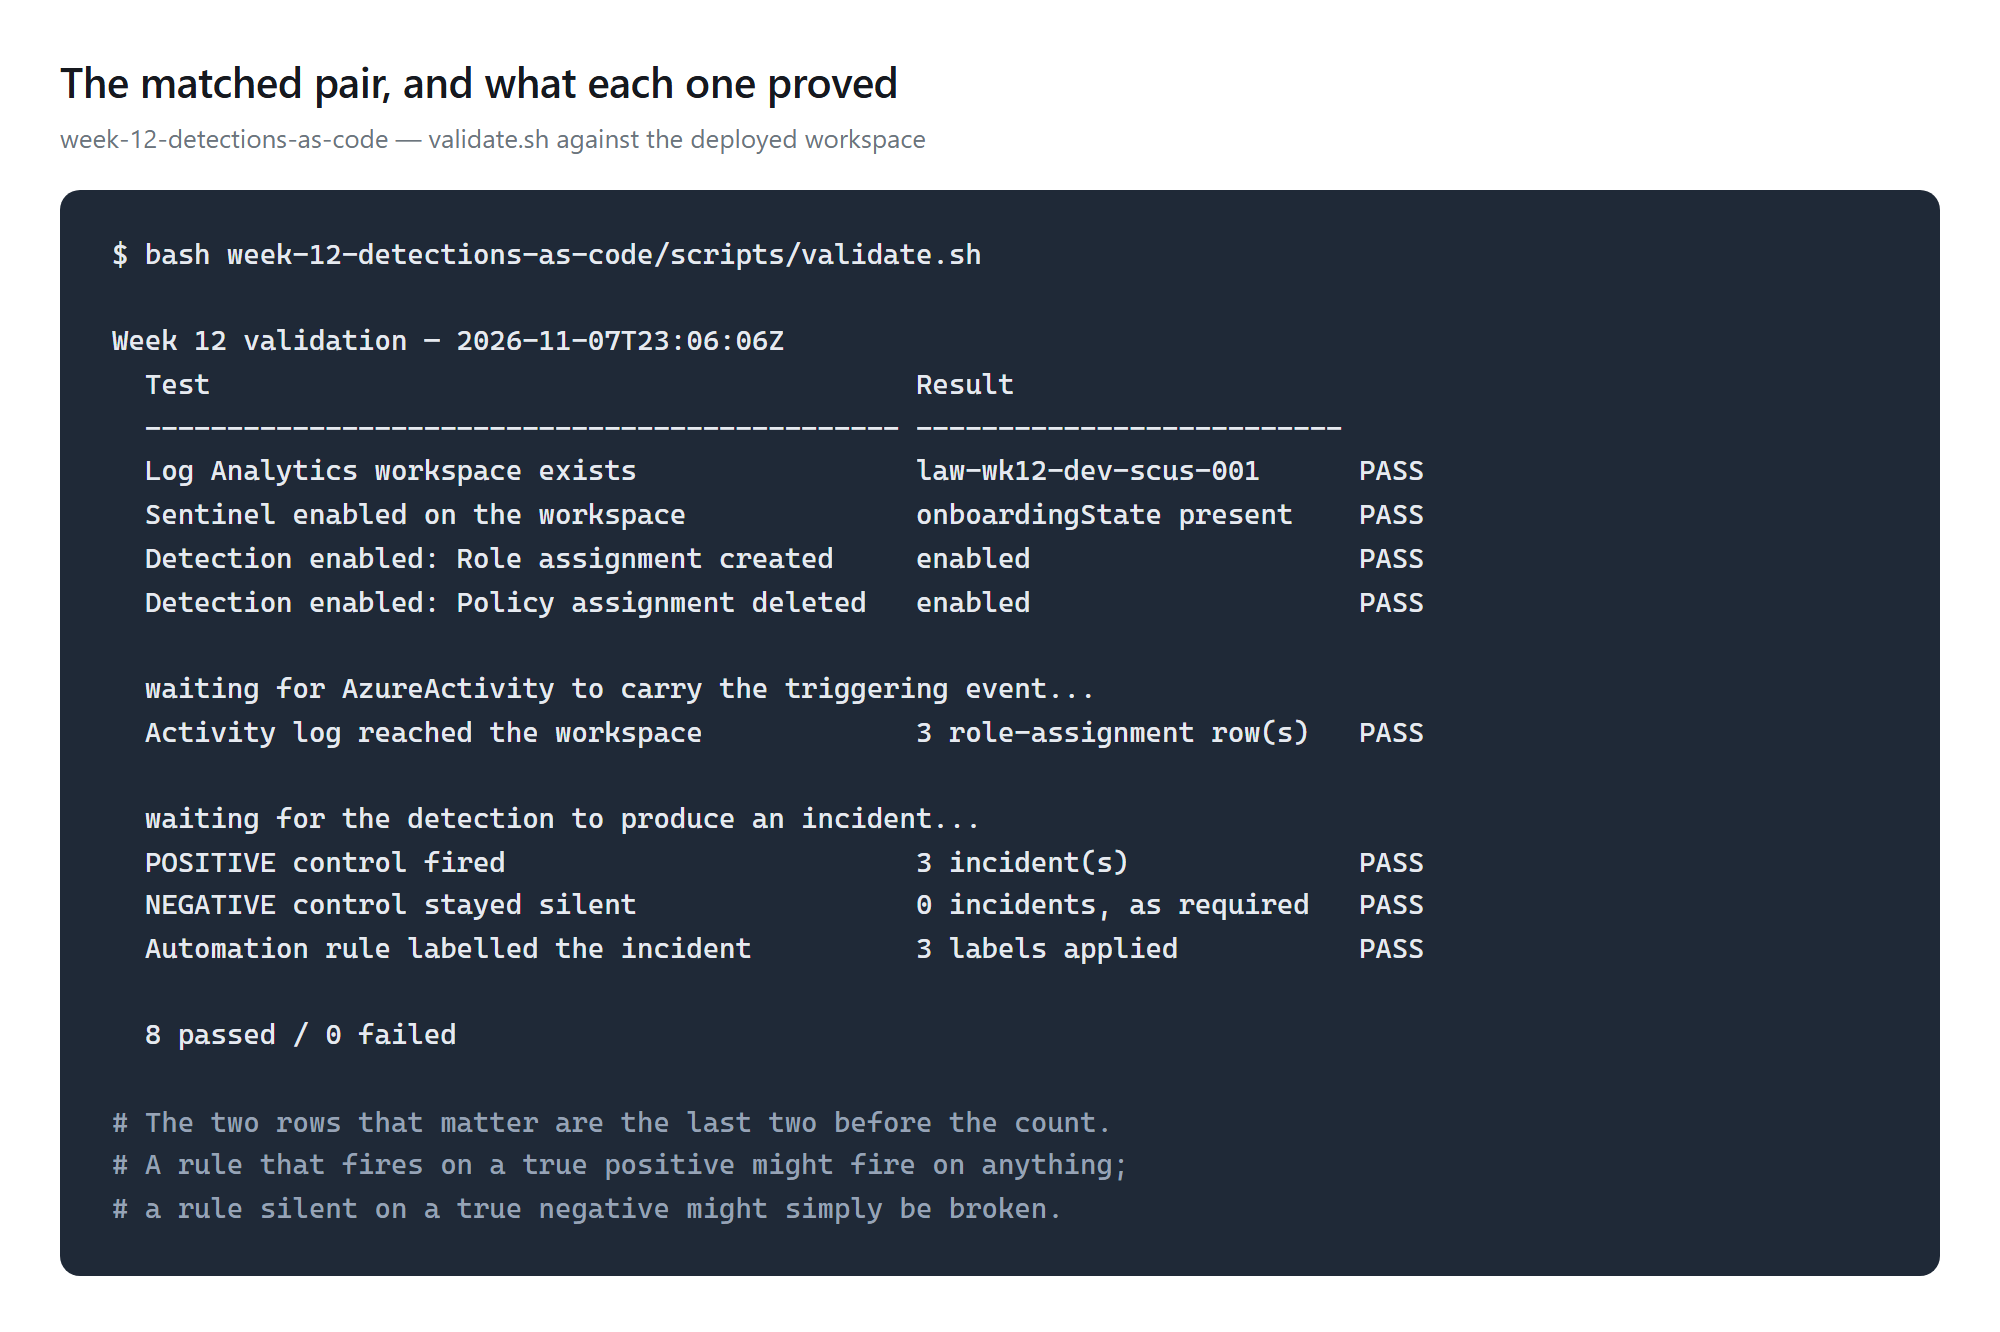
Note on what is missing. There is no console screenshot of
the incident itself. The Azure portal's Sentinel Incidents page rendered a full
grid once and then, twenty minutes later, served "This page has been moved
to the Defender portal" on three consecutive attempts; its Overview tile
separately reported Incidents (0) while the API returned two. The
Defender portal needs a sign-in this subscription's identity cannot complete.
Rather than publish a frame that contradicts the data, the slot is retired and
the gap recorded.
Security and Cost
Security. No secrets exist in this week — there is nothing to authenticate. The deliberately-created role assignment is Reader, at the week's own resource group, revoked explicitly before teardown rather than left to disappear with the group. The detection is deliberately untuned: a real tenant writes role assignments constantly through automation, and shipping this as-is would page someone hourly. Production adds a baseline — known automation principals excluded by object id, scope narrowed to privileged roles. That is a watchlist, and it is next week's problem.
Cost: effectively zero, and here is each leg of it.
AzureActivityis a free data type in both Log Analytics ingestion and Sentinel analysis.- Enabling Sentinel grants 10 GB/day free for 31 days.
- Retention stays at the 90 free days; a Terraform
validationblock refuses a higher value rather than trusting a comment. - No Logic App and no data lake tier — both are explicitly outside the trial's waiver.
The measured invoice figure is not in yet; this post will carry it rather than a rate-card estimate. What is established is the complete list of meters that could have applied, written down before deployment.
Troubleshooting and Lessons
Problem. Sentinel onboarding failed with
MissingSubscriptionRegistration after the workspace was already
built.
Root cause. Microsoft.OperationsManagement —
a fourth provider, beyond the three you would predict.
Resolution. Register it; 50 seconds.
Lesson. Provider registration is a deployment precondition, and
the list is not guessable. Check before applying, not after.
Problem. The analytics rules failed with "Workspace is
not onboarded to Microsoft Sentinel" — which reads like the
onboarding resource failed. It had not.
Root cause. Every Sentinel resource references the
workspace id, so the only dependency in the graph was on the workspace.
Nothing said Sentinel had to be enabled first, and Terraform created
the rules in parallel with the onboarding.
Resolution. An explicit depends_on.
Lesson. A semantic dependency with no value flowing
across it is not a dependency until you declare it.
Problem. I reported "one incident from three rows, grouping
working." Eighteen minutes later there were two. Seven hours later, three.
Root cause. I was measuring the wrong thing. The incident count
slides as the query window moves.
Resolution. Measure the ratio: 13 alerts into 3
incidents, one of which absorbed eleven by itself.
Lesson. A number that changes when you look again was never the
measurement. Ungrouped, this would have been thirteen incidents for one thing
that happened.
Problem. The portal would have produced a screenshot
asserting the opposite of the truth — twice.
Root cause. The Overview tile is an aggregate with its own
refresh, not a view of the data; and the Incidents page is mid-migration to the
Defender portal.
Lesson. Validate against the API and the table, not
against a console tile. Sentinel loses Azure portal support after
31 March 2027; on this tenant the incident views went first.
Cleanup and Key Takeaways
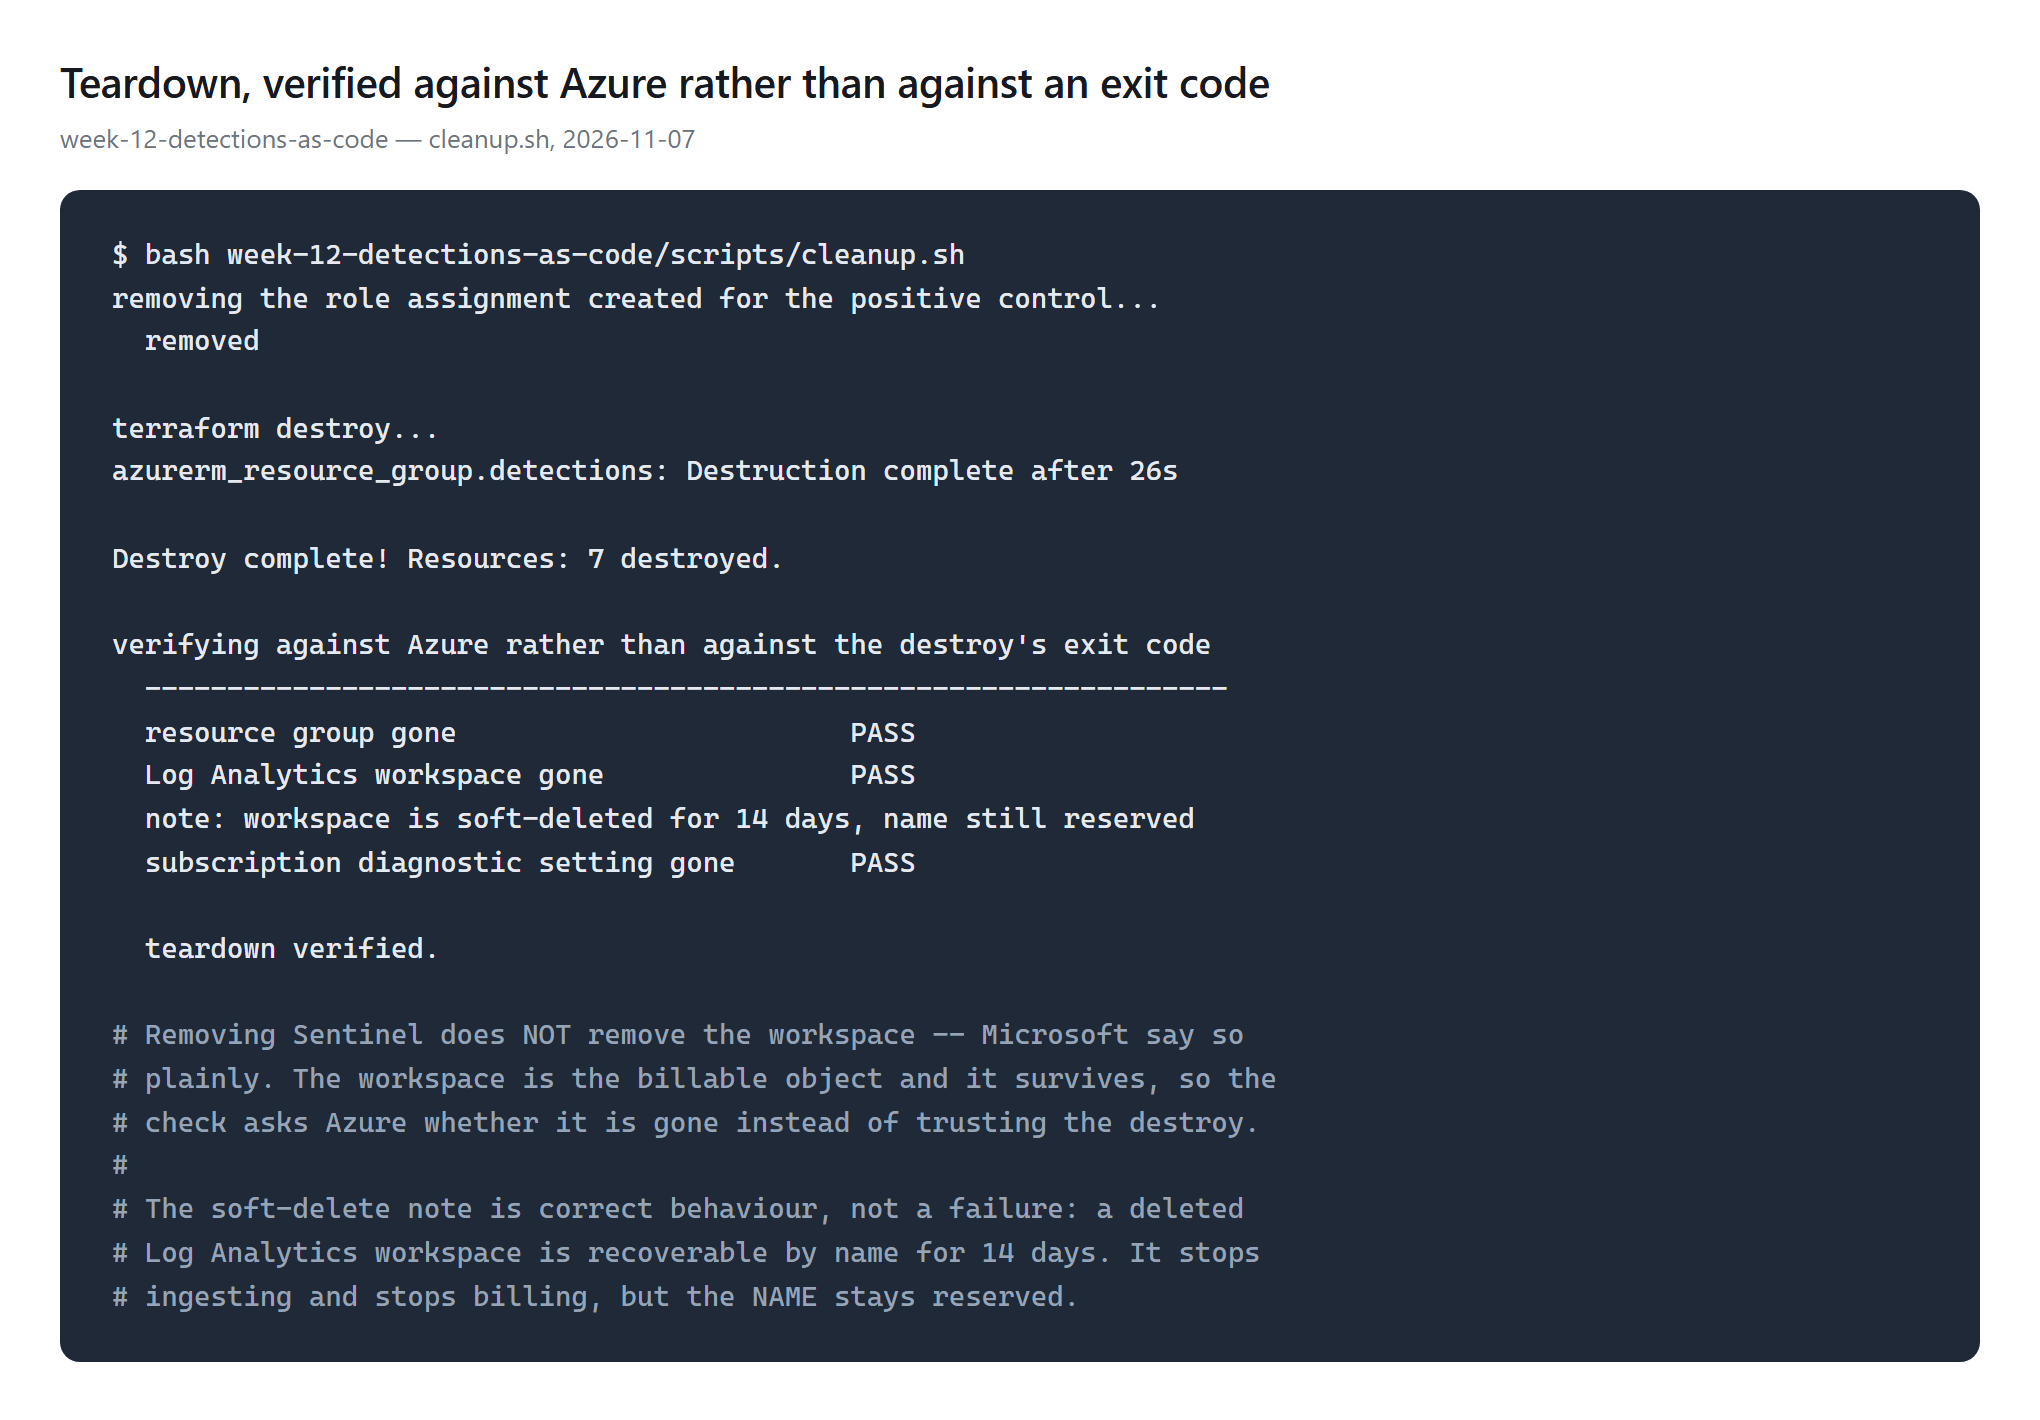
The teardown trap, in Microsoft's words: "Removing Microsoft Sentinel doesn't remove the Log Analytics workspace Microsoft Sentinel was deployed on, or any separate charges that workspace might be incurring." Offboarding Sentinel is not cleanup. The workspace is the billable object.
The subscription-scope diagnostic setting is also outside the resource group, so deleting the group leaves it behind, pointed at a workspace that no longer exists. Both are checked explicitly.
Takeaways
- A detection is only proved by a pair. One that fires and one that must not. A rule that fires on a true positive might fire on anything; a rule silent on a true negative might simply be broken.
- The query window must exceed the ingestion delay. Set it equal to the frequency and the rule silently never fires — and looks exactly like peace.
- Measure the ratio, not the count. 13 alerts into 3 incidents says what grouping did. "3 incidents" says almost nothing.
- Price the week before you build it. Not by reading carefully — by a gate that will not pass until every flat recurring meter is acknowledged in writing.
- Trust the API over the console. Here the portal disagreed with the data twice in one afternoon.
Repository:
week-12-detections-as-code
— Terraform, validation, cleanup, and the committed
meters.json recording every charge this week accepted.
Comments