📋 In This Post
Why — The Problem This Solves
During Week 12 of this series, the account’s AWS Config recorder was deleted in the middle of a build. Not by me, and not by anything in that week’s Terraform — an unrelated project’s cleanup script reached across and removed it. The build broke, I rebuilt the recorder, and the week carried on.
What I could not do, at any point, was find out who deleted it. Not approximately. Not with effort. The information was gone the moment it happened, and no amount of looking at the current state of the account was going to bring it back.
That is the gap this week fills, and it is a different gap from the one the previous few weeks filled. Security Hub and GuardDuty find the open security group and close it. Config reports whether a resource is compliant. Both of those describe state — what is true right now. Attribution is about actions — what somebody did, in what order, from where.
The distinction matters most at exactly the moment you care. An auto-remediation that closes an open security group is doing its job, and it is also destroying the evidence: after it runs, the state is clean and the state is all you have. The only durable record that the group was ever open, and that a specific principal opened it, is the action record.
Why teams do not already have this
Almost every AWS account has CloudTrail switched on. Very few can answer “who deleted this” in under an hour, for three reasons that compound:
- The console’s Event history only goes back 90 days and only covers the account you are looking at. It is a viewer, not an archive.
- The logs are in S3 as gzipped JSON, one file per account per region per five minutes. Readable in principle; unusable at incident speed.
- The query layer is the part nobody builds, because it is not required by any compliance checkbox. Turning the trail on satisfies the auditor. Making it answerable satisfies nobody until the day it matters.
The roadmap topic for this week was impossible
This slot was planned as CloudTrail Lake + audit automation. That build cannot be made any more: CloudTrail Lake closed to new customers on 31 May 2026, and this account has no existing event data store, so there is no way in.
The awkward part is that AWS’s own documentation for querying an organization trail with Athena still ends by suggesting Lake instead — advice that cannot be followed by anyone starting today. Rather than substitute an unrelated topic, I kept the question and built the answer the documentation stops short of.
What You Need to Know — Skills & Tools
| Concept | What actually matters |
|---|---|
| Management vs data events | Management events are control-plane actions — create, delete, modify, sign in. Data events are object-level access. Every question this week asks is a management event, and data events bill from the first copy. |
| Organization trails | One trail in the management account covers every member account, including accounts created after the trail. Requires trusted access, which has no clean Terraform path. |
| Athena partition projection | Partitions computed from a template instead of discovered by a crawler. No DPU cost, no lag — but the template must match the delivered prefix exactly, and a mismatch returns zero rows while reporting success. |
| Glue Data Catalog | Holds the table definition and the projection properties. Nothing crawls; the table states where the data is and how to compute the partitions. |
| CloudTrail’s JSON schema | Role sessions leave useridentity.username null — the useful name is in sessioncontext.sessionissuer.username. Miss that and you miss nearly every Terraform-driven action. |
| Federated vs IAM identities | The difference decides whether the MFA field means anything at all. This is where I got it wrong — see Challenges. |
Architecture — How It Fits Together
One trail across the organization, delivering into S3 under a prefix that carries the organization ID; a table defined rather than crawled; and two consumers on top — seven saved queries run by a human after something has happened, and a daily Lambda that turns three “should be zero” questions into alarms.
Five projected keys, not one
AWS publishes two recipes for CloudTrail on Athena, and neither fits an organization trail:
- The partition-projection example covers a single account in a single region — one
timestampkey overAWSLogs/<account-id>/CloudTrail/<region>/. - The organization-wide page handles the extra path segment, but only with manual
ALTER TABLE ADD PARTITION— one statement per account, per region, per day — and then recommends Lake.
So the documented options are a table that cannot see an organization, a chore AWS itself calls cumbersome, or a service you can no longer sign up for. This build projects five keys instead of one:
AWSLogs/<org-id>/<account>/CloudTrail/<region>/<year>/<month>/<day>/
                 ^^^^^^^^^             ^^^^^^^  ^^^^^^^^^^^^^^^^^^^^^^^
                 enum                  enum     integer projections
The honest trade-off. Dates project infinitely, but accounts and regions cannot — projection needs a finite set, so both are enums. An account missing from that enum has its events sitting in S3, intact, and invisible to every query you will ever run. A Glue crawler would discover them automatically, at the cost of DPU-time on a schedule and lag behind new partitions.
The account list is derived from live organization state filtered to ACTIVE, so the code self-corrects on the next apply. The table still does not: adding an account requires an apply.
Why the region enum covers every enabled region
Not just the regions in use — every enabled one. One of the questions this build exists to answer is “did anything happen in a region we don’t use?”, and a narrow enum makes that structurally unanswerable. The query would return an empty result, confidently, forever.
How We Built It — Step by Step
Step 1 — Deploy via HCP Terraform
Same pattern as every week in this series: a VCS-connected HCP workspace using OIDC dynamic credentials, so no AWS keys exist anywhere.
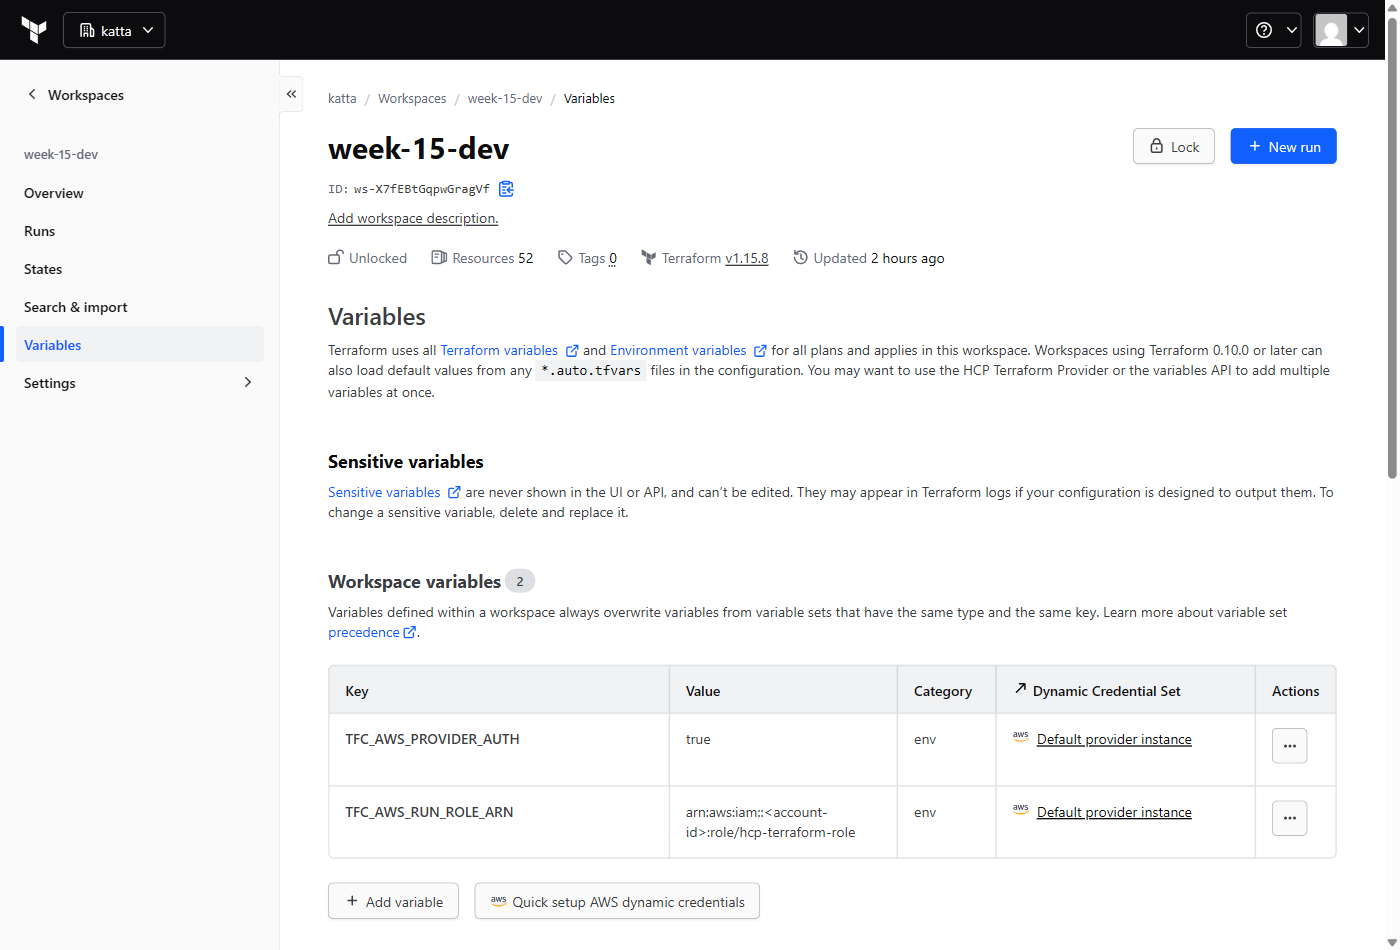
TFC_AWS_PROVIDER_AUTH and TFC_AWS_RUN_ROLE_ARN.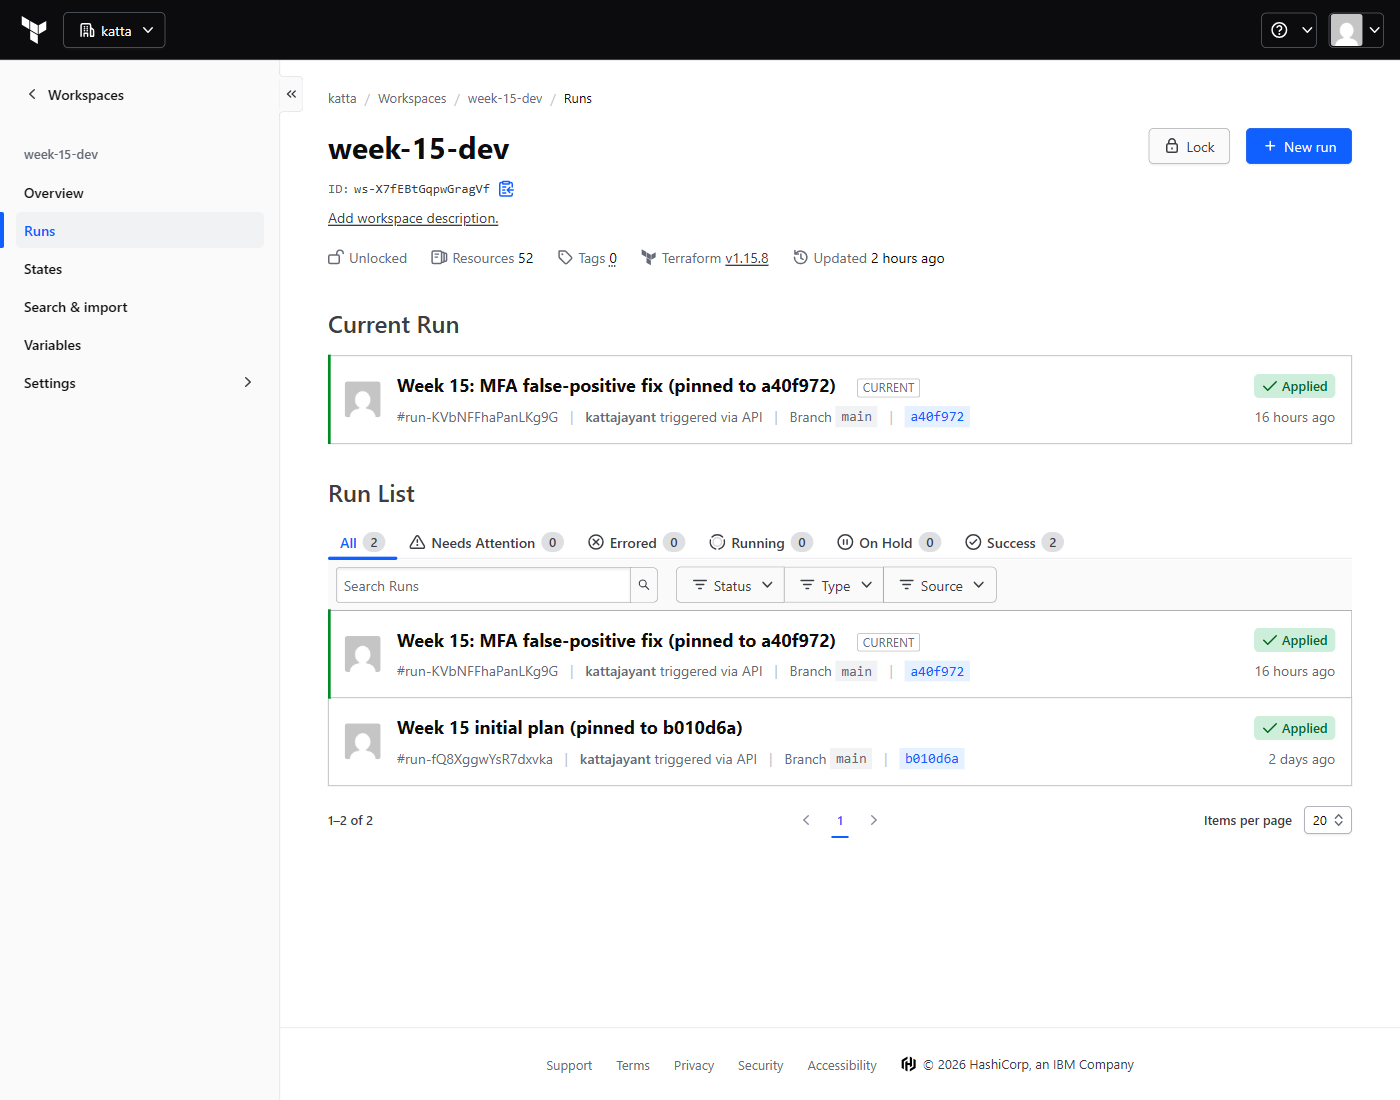
One manual prerequisite has no clean Terraform path, so it is documented rather than hidden:
aws organizations enable-aws-service-access \
  --service-principal cloudtrail.amazonaws.com
Without it, CreateTrail fails with CloudTrailAccessNotEnabledException. Terraform must also run in the organization management account.
Step 2 — The organization trail
Management events only, multi-region, log file validation on.
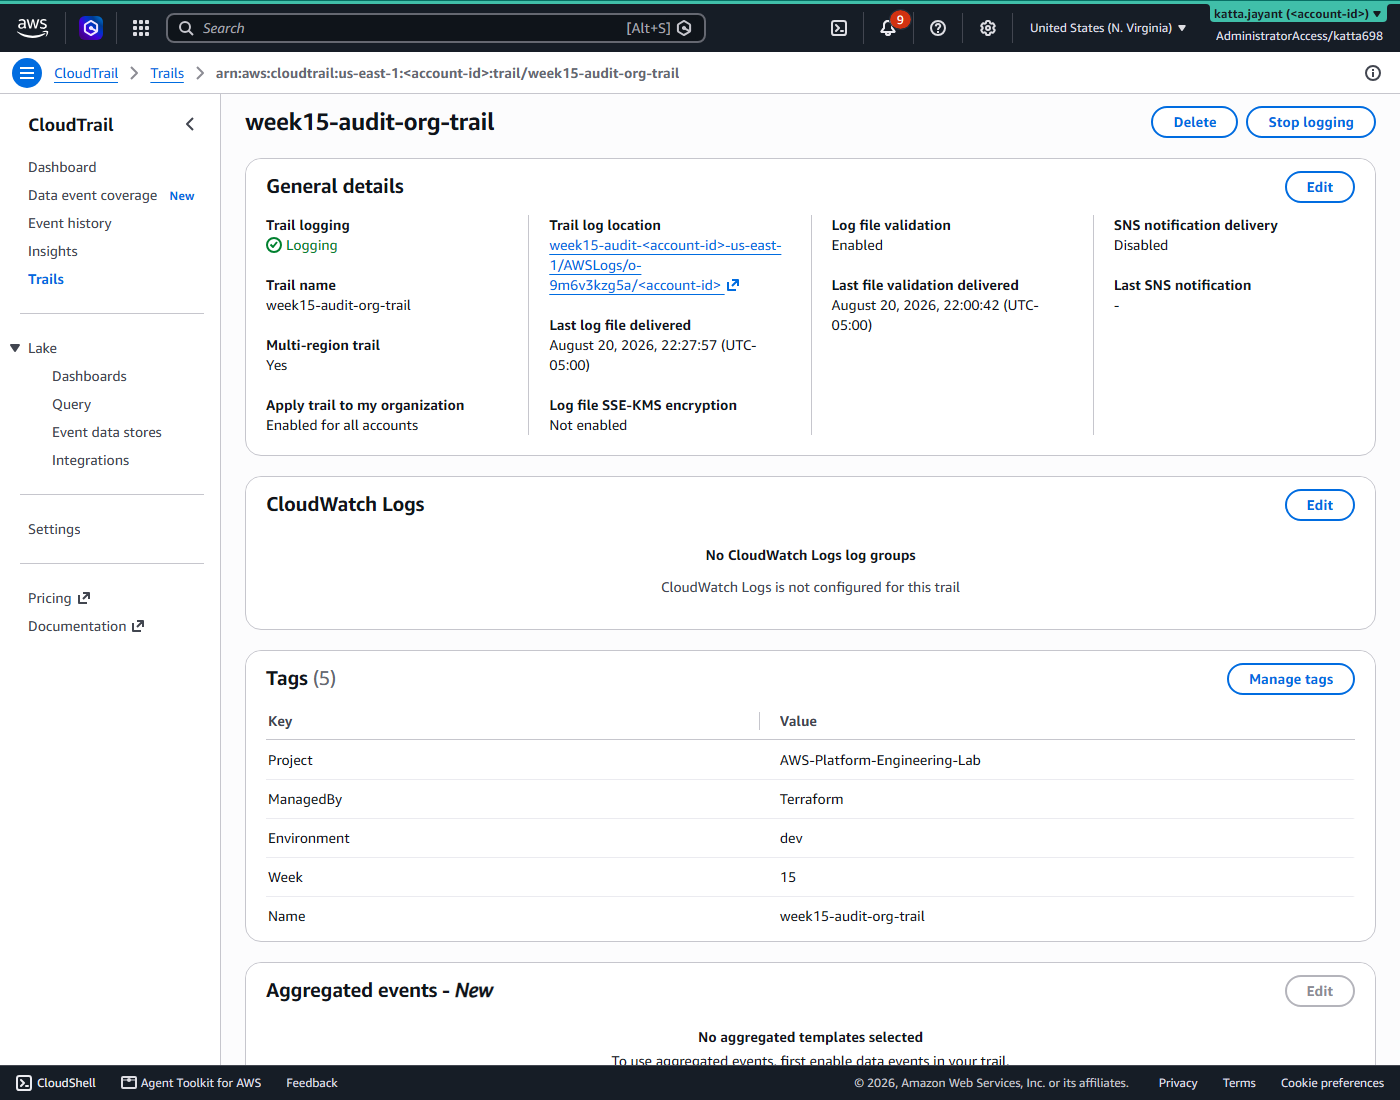
AWSLogs/o-…/ segment.Log file validation is cheap and worth switching on by default. It writes signed digest files, which is what later lets you prove a log was not altered after delivery. An audit trail nobody can vouch for is weaker evidence than one that carries its own integrity proof.
Step 3 — The delivered prefix is the whole problem
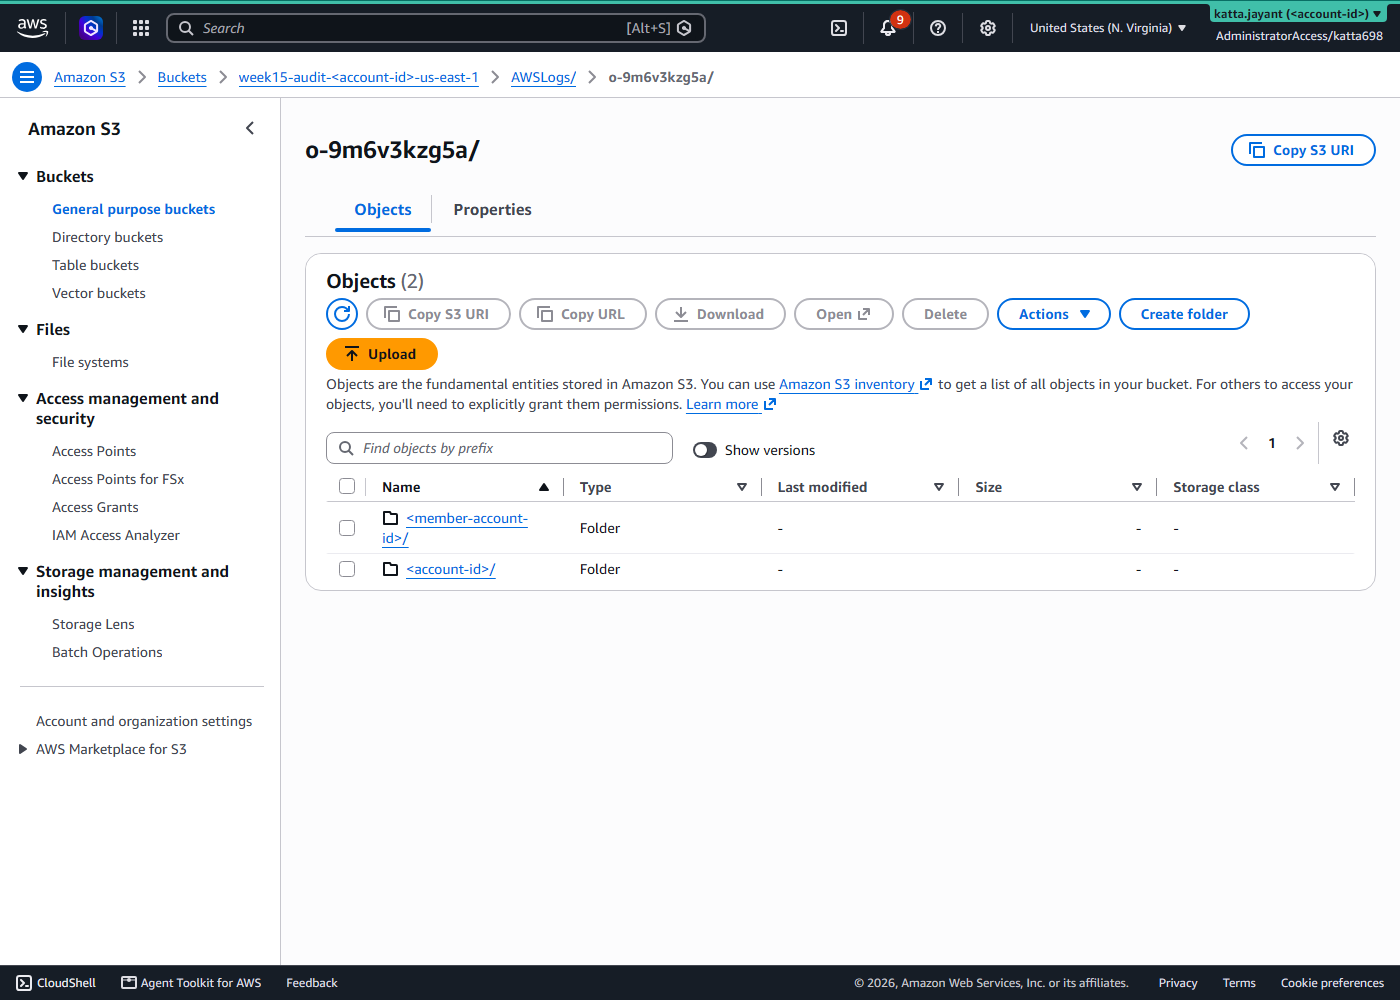
AWSLogs/o-…/, one folder per account. That extra segment is the entire difference from the single-account layout AWS documents, and it is what the projection template has to reproduce exactly.A detail worth pausing on: the bucket policy has to grant CloudTrail write access to AWSLogs/<org-id>/* and AWSLogs/<account-id>/*. Grant only the account prefix and the trail still creates successfully, reports healthy, and silently drops every member-account delivery.
Step 4 — Define the table, crawl nothing
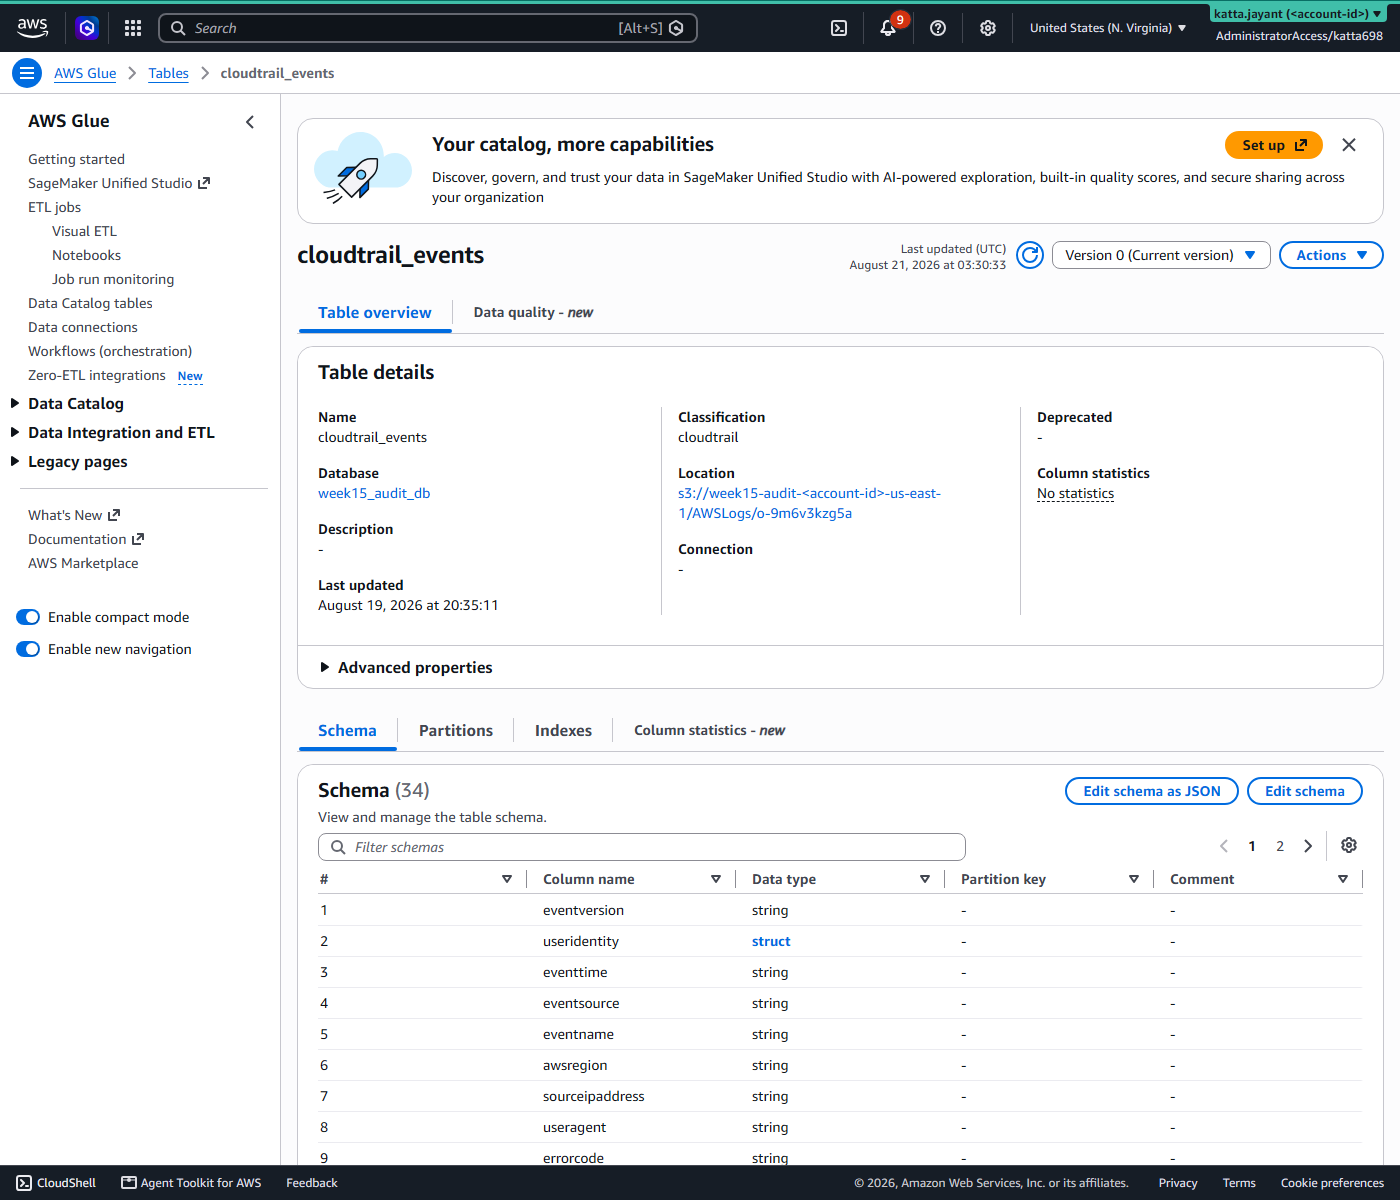
cloudtrail, location pointing at the org prefix. Nothing crawled this — the definition states where the data is.Verifying it actually works
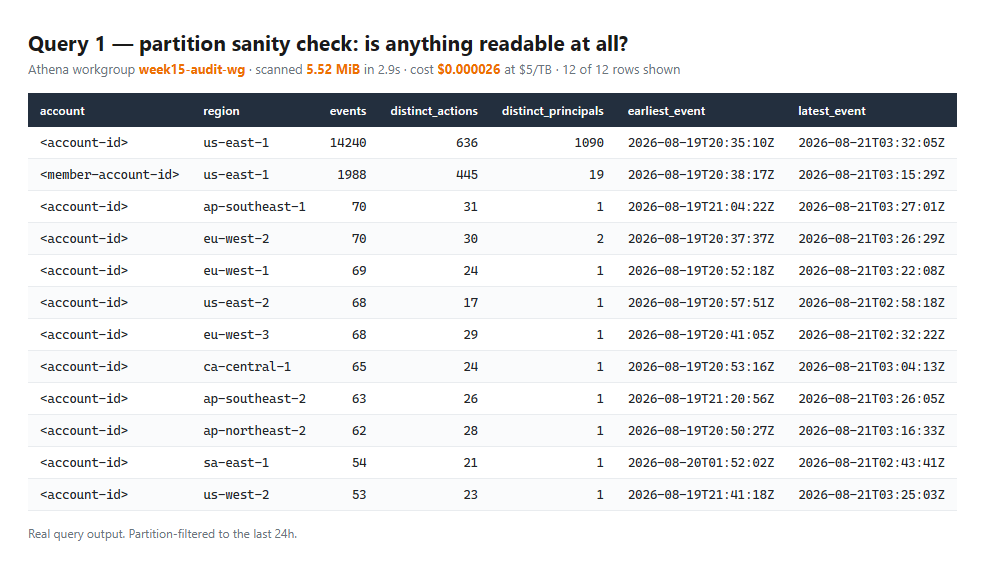
This is not optional, and it is the step most likely to be skipped. Every failure mode in this build is silent: a projection template that does not match returns zero rows and reports SUCCEEDED. So the first query to run is the one that proves anything is readable at all.
Step 5 — Answer the Week 12 question
To have something real to find, I created, tagged and deleted an SSM parameter, then asked the table who did it.

Look at the bottom three rows. Those are from an earlier, broken run of the same script, and the parameter name reads C:/Program Files/Git/week15-audit/demo-…. That is not a typo in the write-up — that is what actually reached the AWS API, recorded verbatim. More on it in Challenges; the point here is that the audit trail caught a bug in my own script that nothing else would have surfaced.
Step 6 — What else did they touch, and what bypassed Terraform
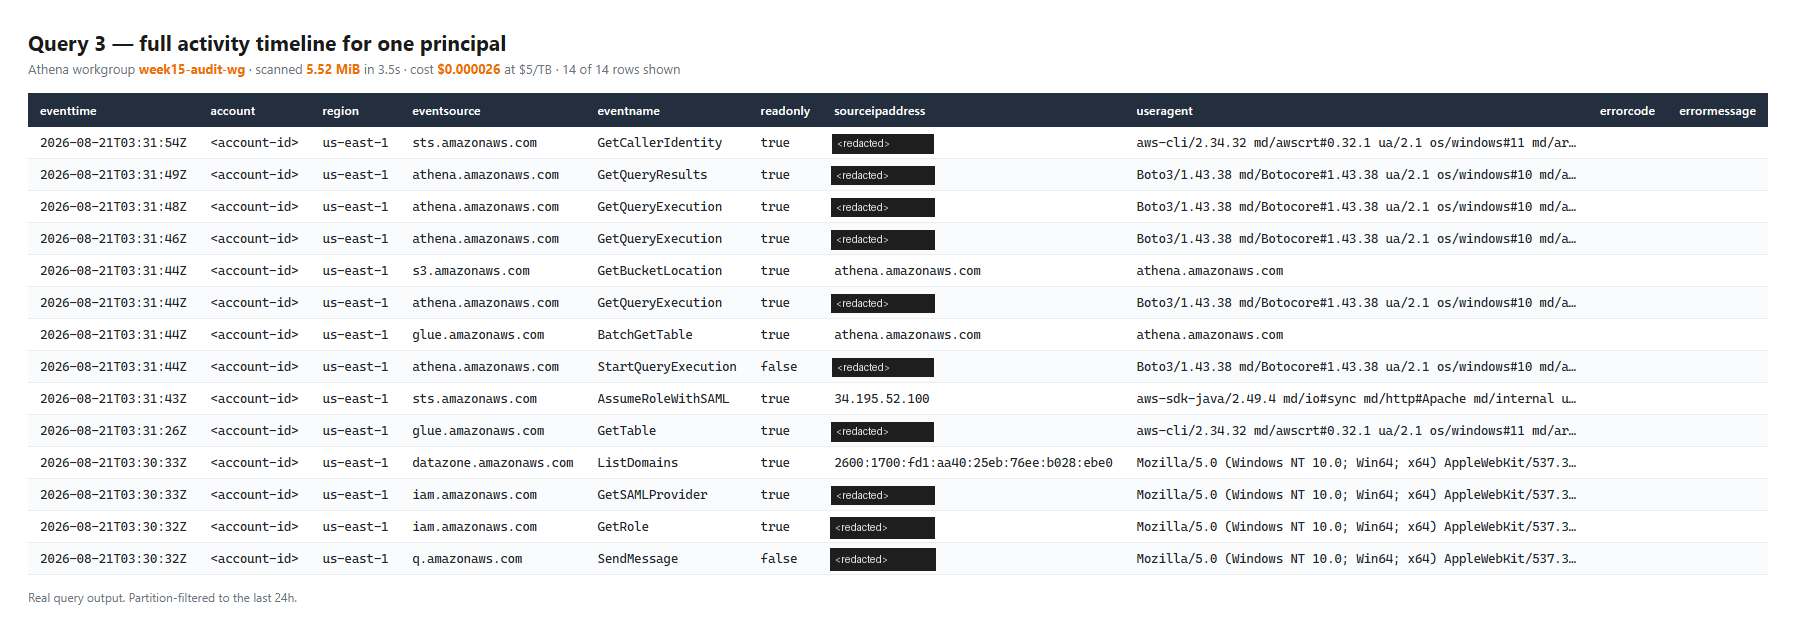
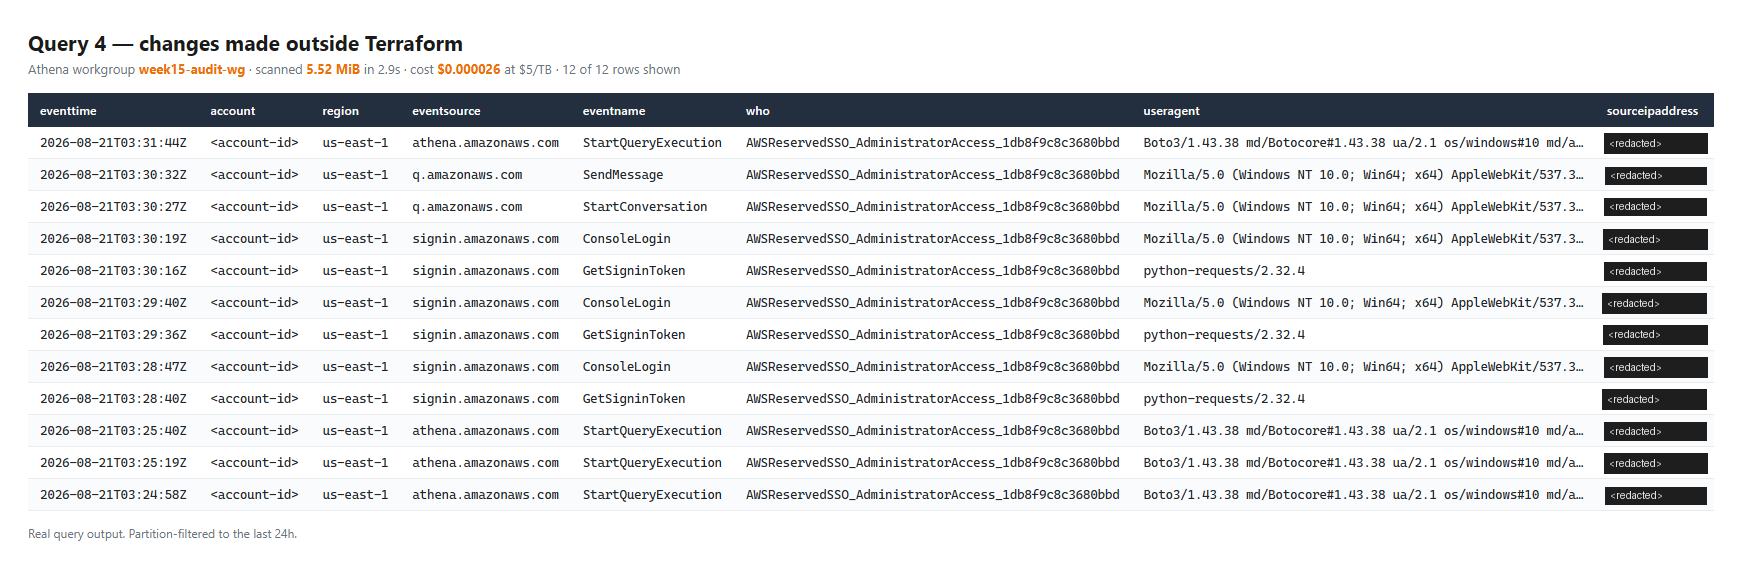
That last query filters on user agent, not principal, and the reason is worth stating plainly: the same role used from the console and used by Terraform is identical by principal and completely different by user agent. Filtering by who did it finds nothing. Filtering by what they did it with finds the drift.
Step 7 — Turn the should-be-zero questions into alarms
Three questions have a correct answer of zero: root account used, console sign-in without MFA, and mutating activity in a region this estate does not use. A daily Lambda runs them and publishes the counts as CloudWatch metrics.
To prove the last one works, I created and deleted a parameter in eu-west-2 — a region this estate does not use — on purpose.
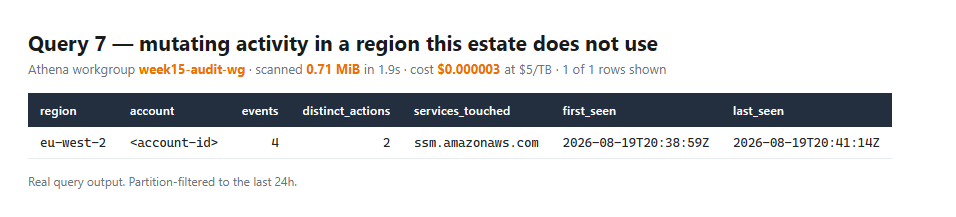
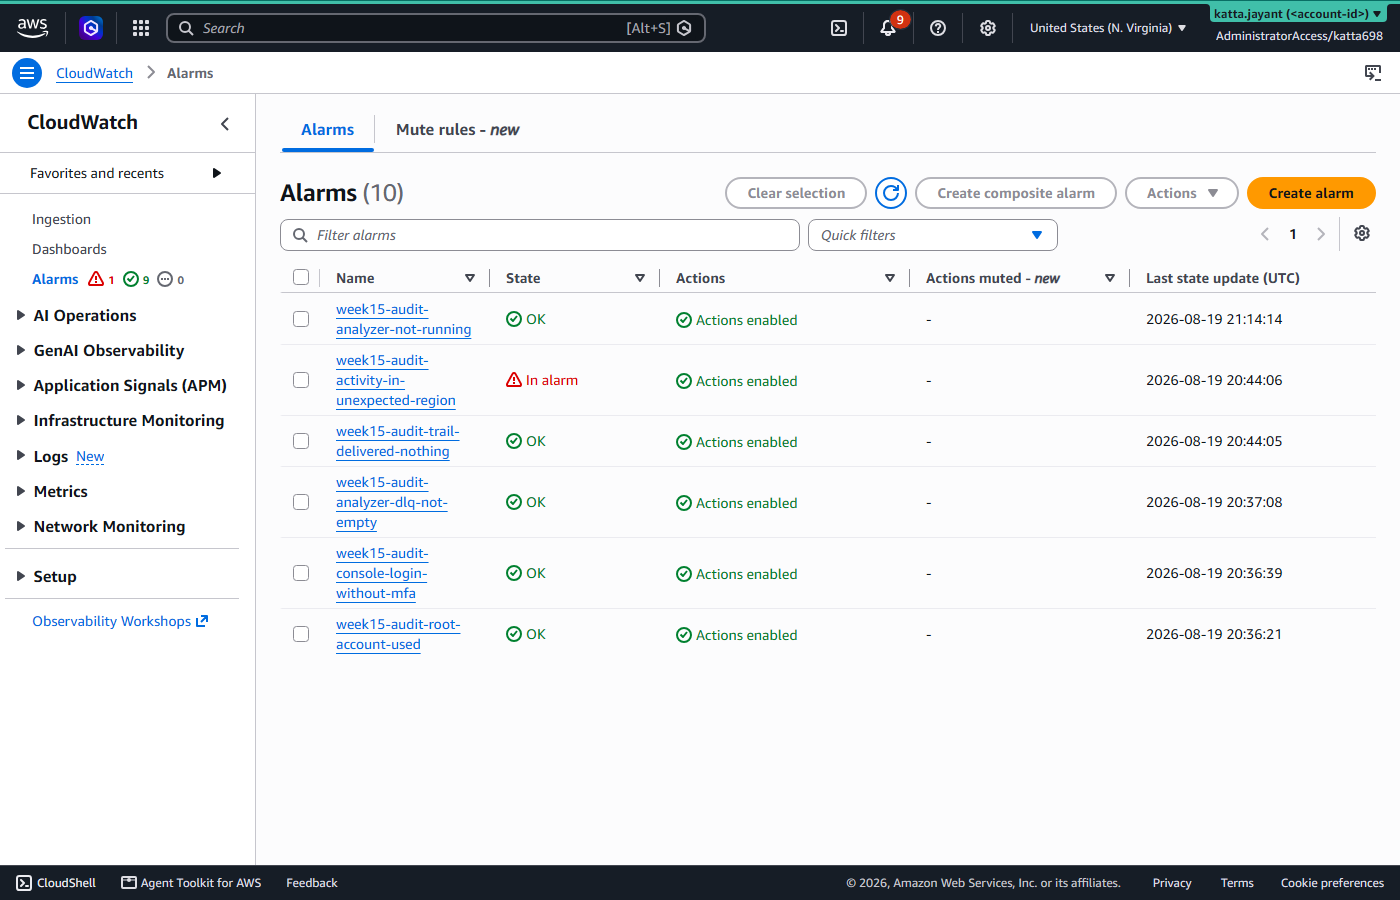
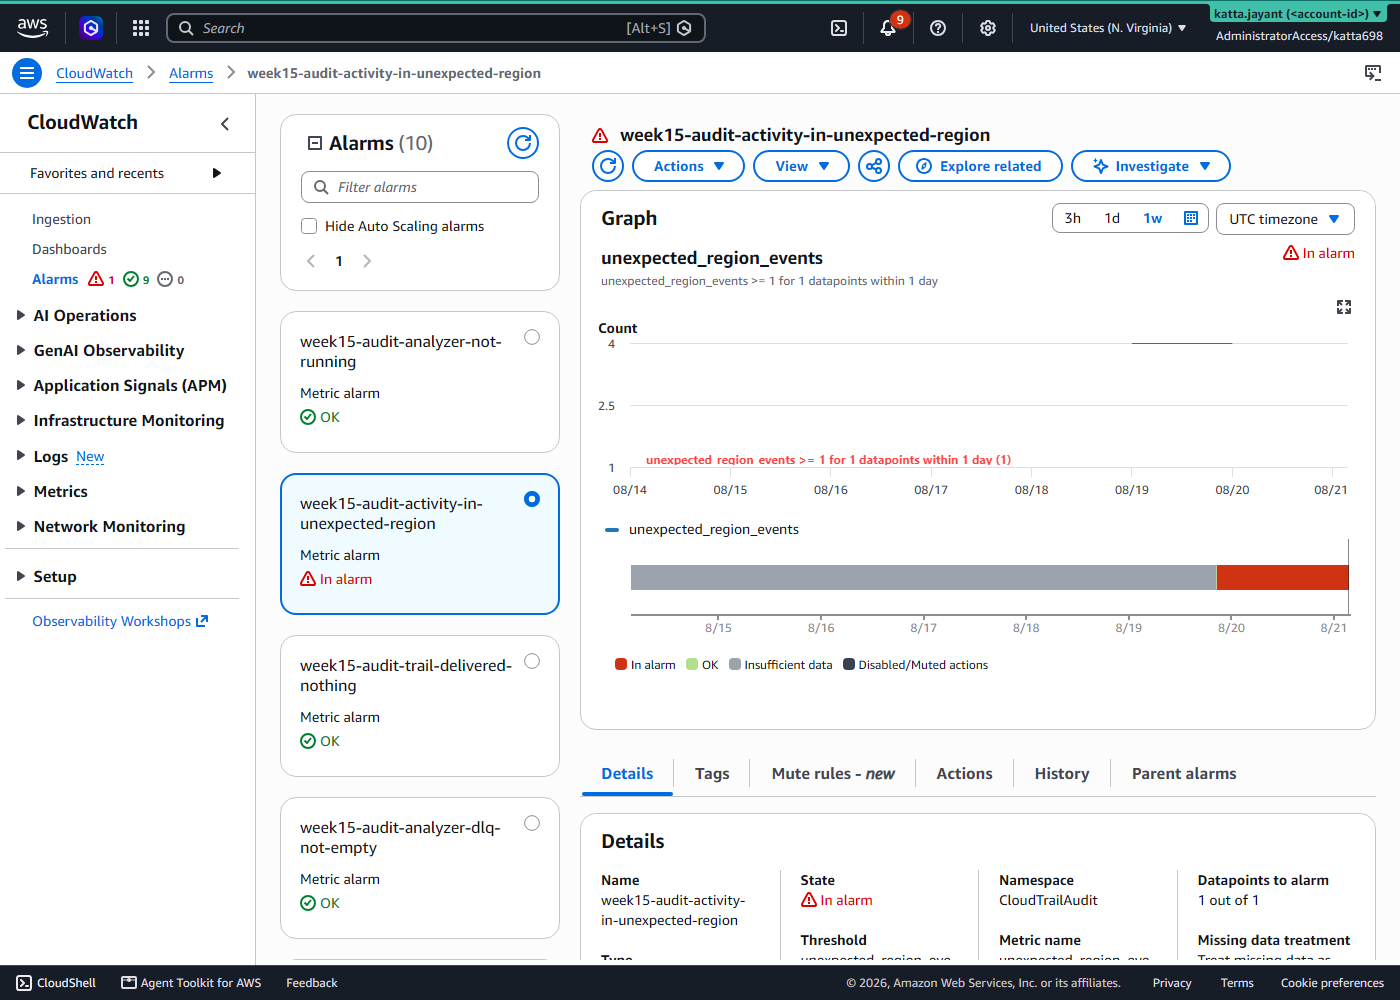
Period: 86400 and Statistic: Maximum in the metric block — those two lines are a defect, and they are covered in Challenges.Every alarm here is a static threshold, and that is a deliberate reversal from last week. Week 14 used anomaly detection for traffic volume — a metric whose normal is genuinely unknown and varies by time of day. These metrics are different: their correct value is a fact, and it is zero. An anomaly band would learn a baseline rate of root logins and stop reporting them, which is precisely backwards. It is also 3× cheaper — $0.10 against $0.30 per alarm per month.
Two of the six alarms exist only to catch the monitoring itself failing. Trail delivered nothing matters most: if the trail stops, all three counts go to zero and read as good news. It uses treat_missing_data = "breaching", so silence is treated as failure rather than health.
Step 8 — Cap the query spend
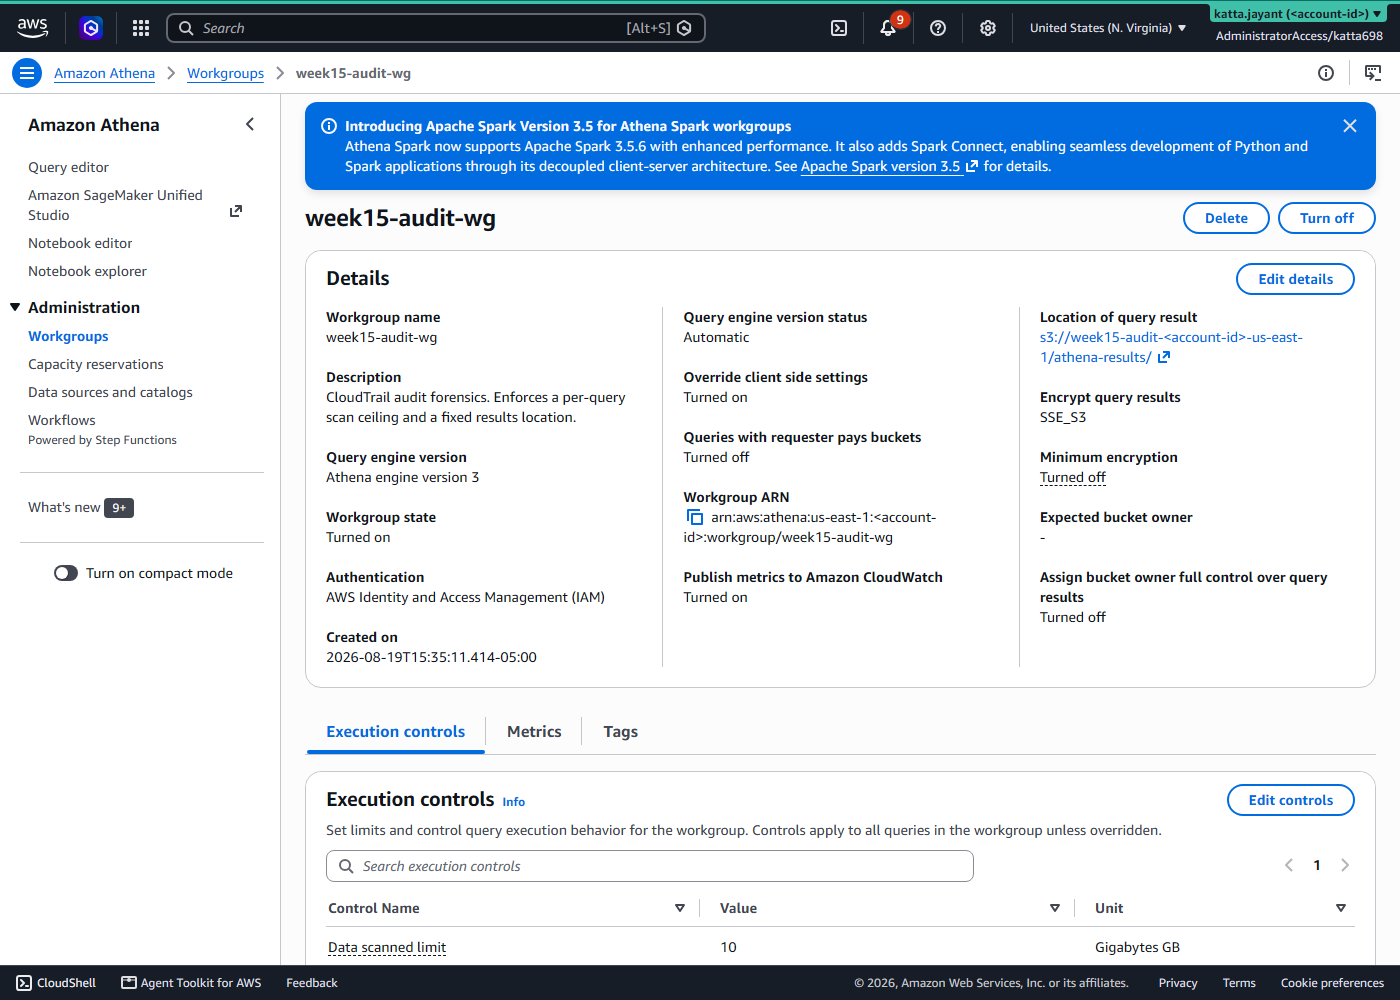
Every query in this post scanned under 6 MiB, because they all filter on partitions. The ceiling is not there for the normal case — it is there for the query someone writes without a WHERE year = clause while an incident is running.
Challenges — What Actually Went Wrong
1. The MFA alarm fired on every normal login — including mine
This is the one worth the whole week.
The console-login-without-mfa check went into ALARM reporting six sign-ins with no second factor. Every one of them was mine, and every one of them was MFA-protected.
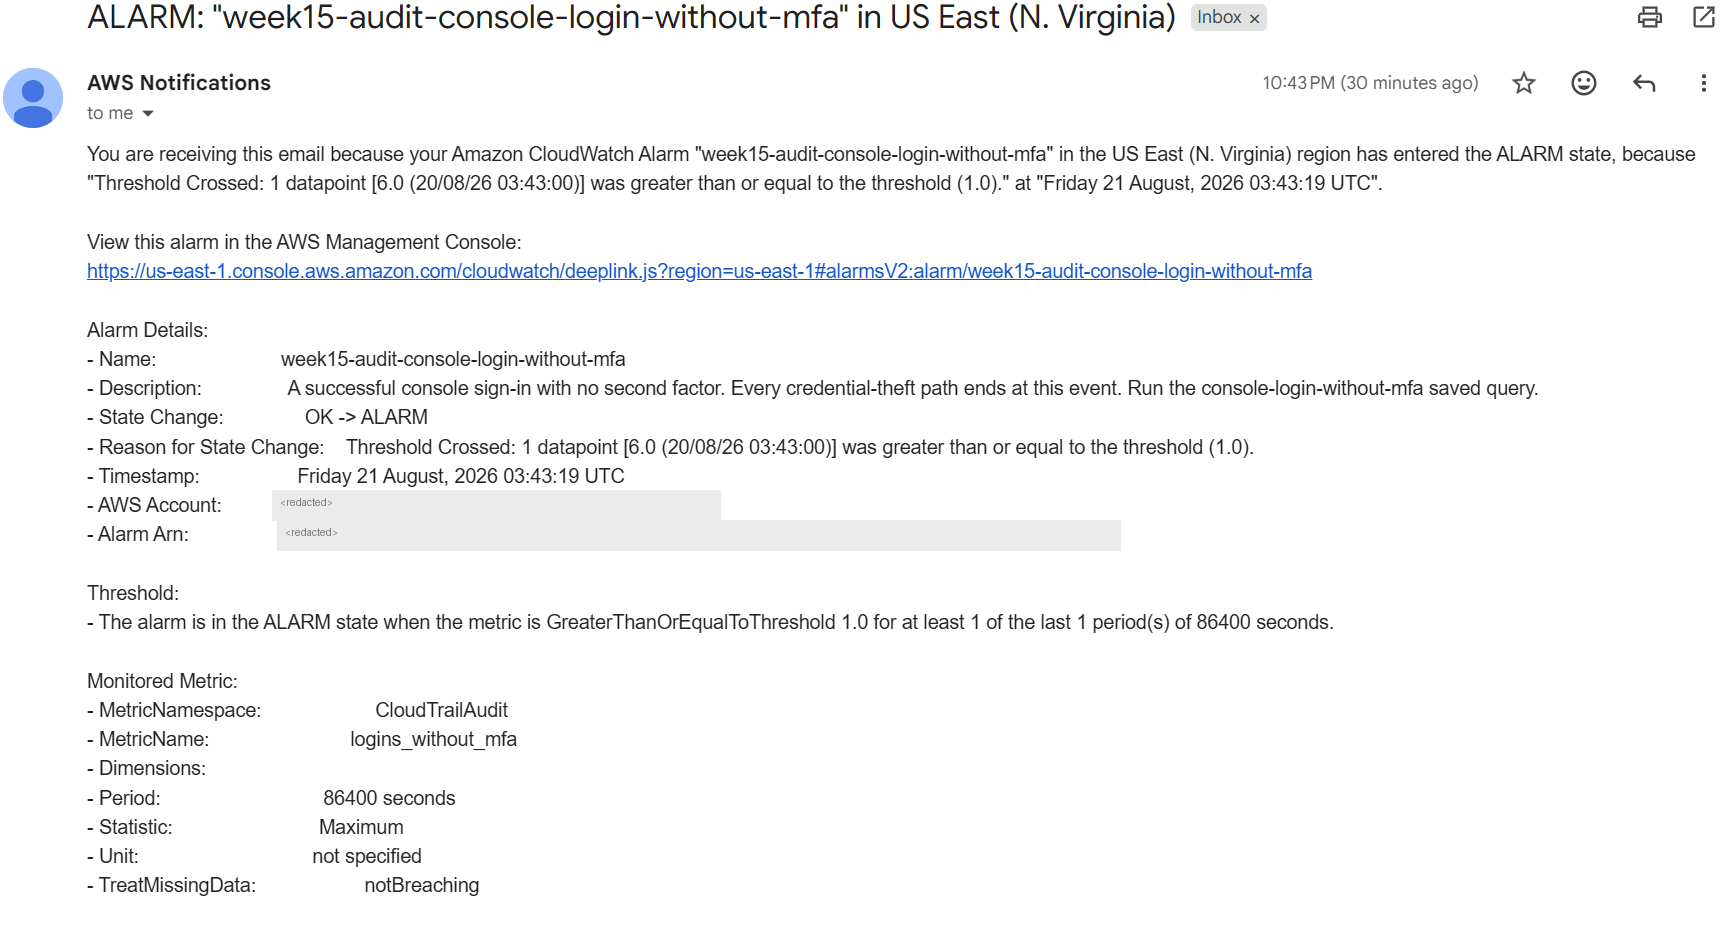
Threshold Crossed: 1 datapoint [6.0]. Six federated logins, every one of them behind MFA.The cause: IAM Identity Center, SAML, and any external identity provider satisfy MFA at the identity provider and then federate into the console. No second factor happens at the AWS sign-in step — it already happened upstream, where CloudTrail cannot see it. So CloudTrail records MFAUsed = "No" on a login that was fully protected.
My original query treated a NULL or non-true MFA field as a finding, and the comment above it confidently explained that the NULL rows were “exactly the ones worth seeing”. That reasoning is from a world where people sign in as IAM users. In an estate using Identity Center — the setup AWS itself recommends — it means alarming on every normal login.
An alarm that fires on routine activity is worse than no alarm. It is training, delivered daily, to ignore the thing. And it fails in the most dangerous direction: the noise is indistinguishable from the signal, so the real event arrives in a channel you have already learned to dismiss.
The fix scopes the check to the principal types where the field reflects a decision AWS actually made, and reads MFAUsed from additionalEventData rather than the session context — a root or IAM-user login has no assumed-role session at all, so the session-context field is NULL even when a second factor was used:
AND useridentity.type IN ('IAMUser', 'Root')
AND COALESCE(json_extract_scalar(additionaleventdata, '$.MFAUsed'), 'No') <> 'Yes'
Verified rather than assumed: of the ten rows matching the old predicate, all ten were federated. The corrected query returns zero, and the analyzer confirms it.
Federated logins are still visible through a companion query — they are just not treated as findings. Excluding a population from an alarm is only defensible if you can still look at it.
2. The alarm latched, and then went quiet for two days
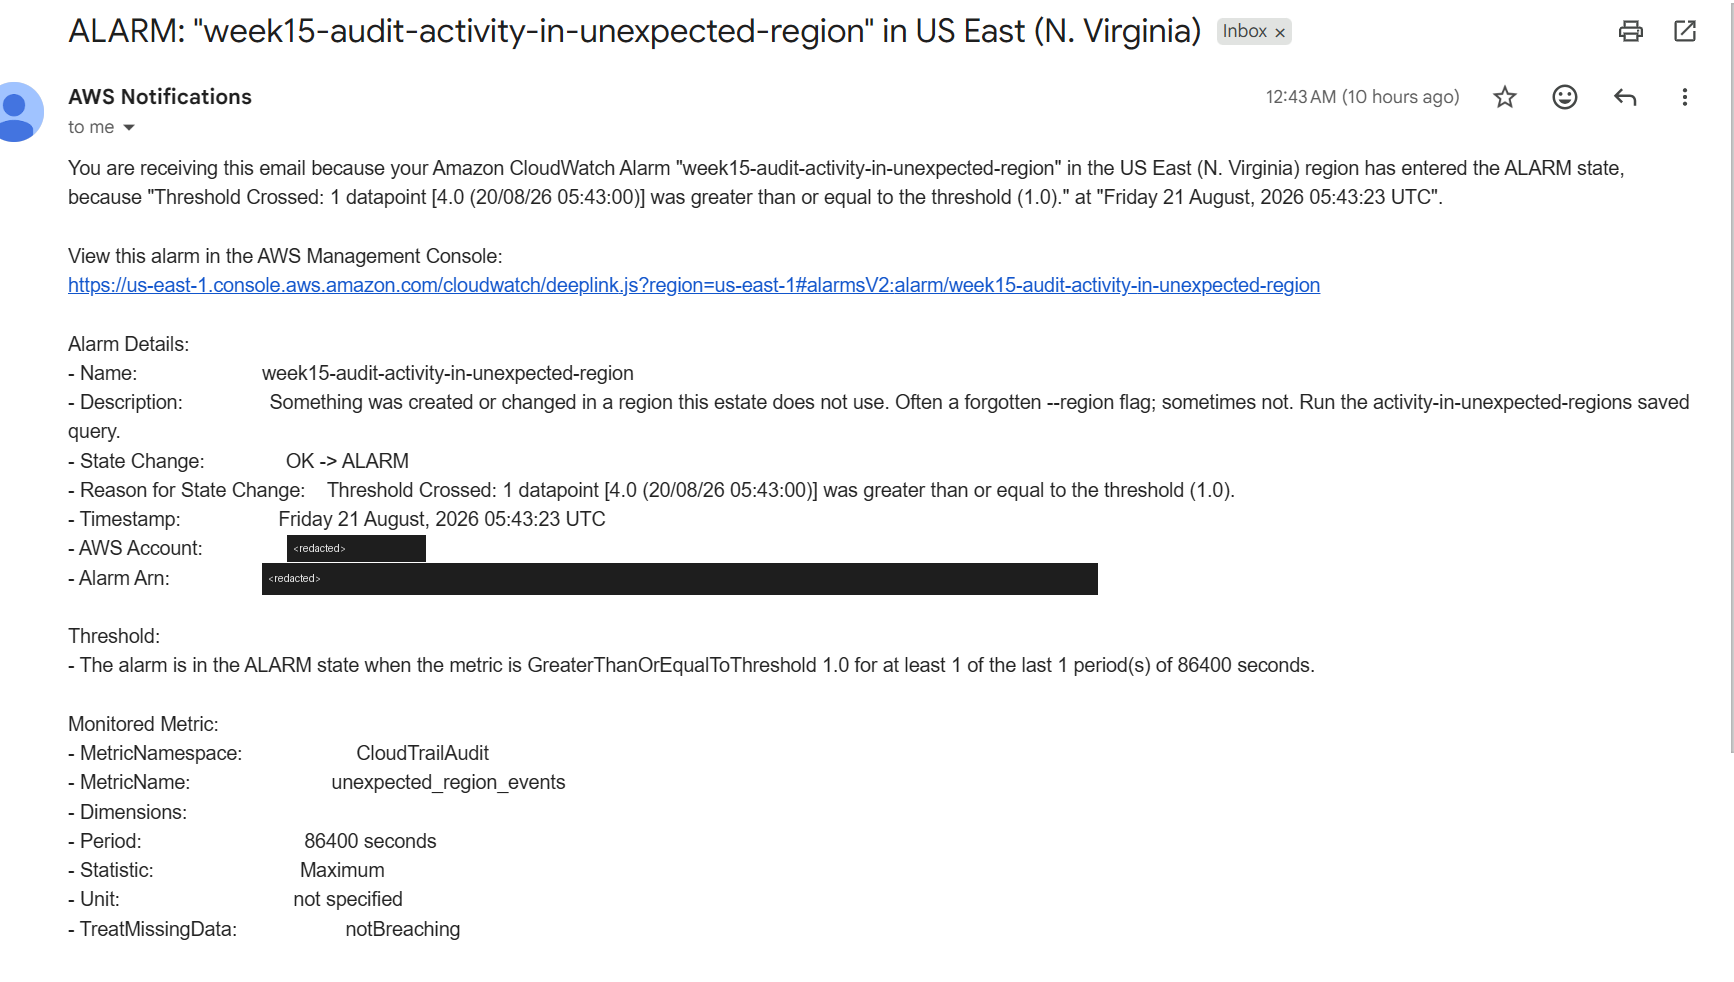
After the write-up was drafted I went to capture the alert email for the unexpected-region detection, and there wasn’t one. The alarm was sitting in ALARM, the detection had worked, the SNS subscription was confirmed — and no mail had been sent since the first trip two days earlier.
CloudWatch notifies on a state transition, not on a state. The alarm had entered ALARM on the 19th and never recovered, so every subsequent detection was silent. Including, crucially, detections of new events.
The reason it never recovered is in the alarm’s own configuration, visible in the screenshot above:
Period:    86400 seconds
Statistic: Maximum
A 24-hour bucket evaluated on Maximum. One event on Monday pins the daily maximum above the threshold for the rest of that bucket, so Tuesday’s clean run cannot bring it back to OK.
This is a worse failure than the MFA false positive, and a quieter one. The MFA bug produced noise, and noise gets noticed and complained about. This one produces silence — you get exactly one alert, ever, and then the channel goes dead while continuing to look healthy. Nothing prompts anyone to check.
There is a detail in that email worth pointing at, because it is the defect catching itself. To capture a real alert I reset the alarm to OK and let the analyzer re-publish against live data, which measured 2 events in eu-west-2. The email that arrived does not say 2 — it says Threshold Crossed: 1 datapoint [4.0]. That 4 is the previous day’s count, still winning the Maximum over the shared 24-hour bucket. The alert fired on two-day-old data while fresh data sat underneath it.
The fix is a shorter period with a longer evaluation window, or Sum over a rolling hour rather than Maximum over a day. What makes this worth writing down is that the Terraform reads perfectly sensibly — a daily check on a daily-scheduled analyzer — and the flaw only exists in how the alarm behaves against real data over real time. Reviewing the code would never have surfaced it. Trying to screenshot the email did.
3. A path-mangling bug produced a partially successful run
The activity-generating script appeared to fail on every SSM call, with Parameter name must be a fully qualified name. That reads like an AWS-side validation problem. It is not one: Git Bash rewrites any argument that looks like a Unix path into a Windows path, so /week15-audit/demo-… arrived at the API as C:/Program Files/Git/week15-audit/demo-….
The trap was already documented in this repo from Week 12, and I failed to apply it. The fix is one line:
export MSYS_NO_PATHCONV=1But the more interesting failure is what the script did with the error. Every call ended in 2>&1 and printed a soft WARN, so a broken run looked like a partial success. CloudTrail is what told me the truth: two of the three calls had actually succeeded against a garbage resource name, and only the tagging failed. A partially successful run against the wrong resource is a considerably worse outcome than a clean failure, and the soft warnings hid the difference.
4. The free copy of management events was already taken
Covered under Cost, because it changes the number rather than the build.
Security — Controls at Every Layer
- Management events only — no object-level access logging, and no per-object cost
- Log file validation on — signed digests let you later prove a log was not altered after delivery
- Bucket policy scoped by
aws:SourceArnto this specific trail, against the confused-deputy case - Non-TLS access denied; all public access blocked,
BucketOwnerEnforced, SSE-S3, versioned - Least-privilege IAM — the analyzer’s Athena permissions are scoped to the one workgroup carrying the scan ceiling. A broad
athena:*would let it bypass the guardrail the design depends on.PutMetricDatasupports no resource-level permission, so it is constrained by a namespace condition instead - Spend as a control — the 10 GB per-query ceiling is enforced at workgroup level, not by convention
- 365-day retention — chosen to outlive the console’s own 90-day history, which is the window most people assume they have
Cost
Prices as of August 2026 — verify at the CloudTrail pricing page.
| Item | Rate | This build |
|---|---|---|
| Management events, first copy to S3 | free | see below |
| Additional management event copies | $2.00 / 100k | this is the one that applied |
| Data events | $0.10 / 100k from the first copy | not enabled |
| S3 storage | $0.023 / GB-month | pennies at lab volume |
| Athena | $5 / TB scanned | cents — every query under 6 MiB |
| Lambda, EventBridge, SNS, SQS, Glue catalog | — | effectively free |
| CloudWatch alarms × 6 | $0.10 / alarm / month | $0.60/month |
| Destroyed | $0 |
“The first copy is free” — check whether something already took it
AWS gives you one free copy of management events per region. Everyone repeats that. The half that gets left out: if a trail already exists in that region delivering management events, yours is the second copy, and second copies bill at $2.00 per 100,000 events.
That was the case here. A pre-existing trail from an unrelated project already held the free copy for us-east-1. Measured rather than estimated, from one day of that trail’s own delivery:
253 files, 11,539 management events (partial day)That extrapolates to roughly 450–600k events/month, so a second copy costs about $9–12/month while the trail is up, or $1–2 across a build-and-destroy. Two details soften it: only the management account’s us-east-1 events are a second copy — member accounts and other regions remain first copies and stay free — and the charge stops entirely on teardown.
The general lesson: before quoting “the first copy is free”, run aws cloudtrail describe-trails and find out whether something already claimed it. I wrote the $0 estimate into the README first and had to correct it.
For contrast, the same data in CloudTrail Lake would be $0.75/GB on the one-year option or $2.50/GB on the seven-year — if you could still sign up for it.
Cleanup
Queue a destroy from the HCP UI, then verify:
./scripts/cleanup.shThe organization trail is the one that matters. Left behind, it keeps writing every management event from every account in the organization into a bucket, indefinitely — and because the first copy is normally free, there is no sharp cost signal to make you notice. Just a bucket that grows, and once the lifecycle rule is destroyed with the rest of the stack, never stops.
The verification script distinguishes three outcomes, not two: gone, still present, and could not check. An expired session that returns an empty list looks exactly like a clean teardown if you only test for emptiness.
Trusted access is deliberately left enabled. It is an organization-level setting, it was a manual prerequisite, and other services may rely on it — removing it is a separate decision from tearing down this week.
One thing this week does not leave behind: orphaned anomaly detectors. Week 14 discovered that they survive terraform destroy because they are a separate API. Every alarm here is a static threshold, so none are created.
References
- Creating a trail for an organization — AWS CloudTrail User Guide
- Querying AWS CloudTrail logs — Amazon Athena User Guide
- Partition projection with Amazon Athena
- CloudTrail record contents — the schema behind every query in this post
- Validating CloudTrail log file integrity
- AWS CloudTrail pricing
- Full source for this week — Terraform, all seven queries, and the verification scripts
Key Takeaways
- State tells you what is wrong; actions tell you who made it wrong. Config and Security Hub answer the first. Only an action record answers the second, and auto-remediation destroys the evidence while doing its job.
- A federated sign-in is not an MFA-less sign-in. CloudTrail records
MFAUsed = "No"for Identity Center logins because the second factor happened at the IdP, where CloudTrail cannot see it. Alarming on that field without scoping toIAMUserandRootmeans alarming on every normal login. - An alarm that fires on routine activity is worse than no alarm. It teaches people to ignore the channel the real event will arrive in.
- An alarm that latches is worse still, because it fails silently.
Maximumover a 24-hour period means one event pins the alarm in ALARM and every later detection is a non-transition, so nothing is sent. You get one alert, then a dead channel that still looks healthy. - Capture the alert email as part of building the alarm, not afterwards. Terraform proves a subscription exists; only the email proves delivery. Going to fetch that screenshot is what exposed the latching bug — two days after it started swallowing alerts.
- Every failure mode in a projected table is silent. Zero rows and
SUCCEEDEDlook identical to a clean result. The only real check is querying delivered data and comparing it against what is actually in S3. - Projection enums are a standing liability. Dates project infinitely; accounts and regions cannot. An account missing from the enum is invisible to every query, with no error anywhere.
- “The first copy is free” is only true if nothing already took it. Check before quoting the number.
What I’d do differently in production
- Replace the account enum with a crawler, or automate the apply. Deriving the list from live organization state fixes the code but not the deployed table. In a real estate, a new account is created by someone who has never heard of this table, and their events would be invisible until the next apply. A scheduled crawler trades DPU cost for not needing anyone to remember.
- Write the trail to a separate log-archive account with a bucket the management account cannot delete from. An attacker with management-account access can currently delete the evidence of what they did.
- Add the companion federated-login query to a dashboard rather than leaving it commented out. Excluding a population from an alarm is defensible; making it hard to look at is not.
- Reconsider the daily schedule for the region check. Root usage and MFA can wait a day. Activity in a region you do not use is the one where a day of latency is genuinely expensive.
Comments