Business Challenge
For years, alarming on logs meant a metric filter: match a pattern, emit a number, alarm on the number. A Log Alarm takes the other route. “A Log Alarm monitors the results of a CloudWatch Logs Insights query that runs on a schedule using a Scheduled Query”, and “Unlike metric alarms that require metric filters as an intermediate step, Log Alarms evaluate directly on log data using the same Logs Insights query language you use for ad-hoc analysis.”
That is a real improvement. A metric filter decides at ingestion time what will be countable later; a query decides at evaluation time what to ask. You can alarm on a field that nobody thought to extract when the log group was created.
But the unit being evaluated has changed. #110 and #111 were about alarms whose datapoints arrive from somewhere and sometimes do not. Here the datapoint is an action the alarm takes — a query execution — and three properties of that follow it into production.
Each execution reads a time range you define: “StartTimeOffset defines the lookback window in seconds for each query execution” and “EndTimeOffset defines the end of the query time range as an offset in seconds from the current time”. The documentation then says the part that matters:
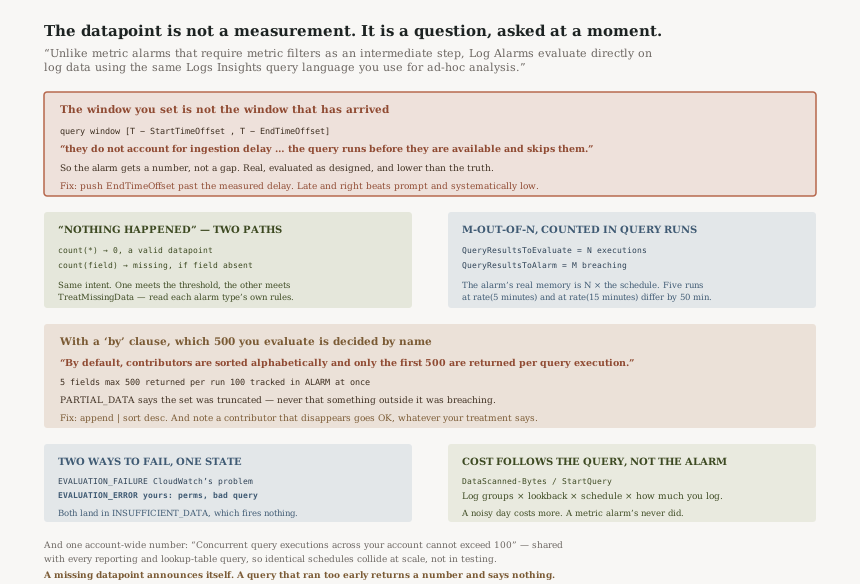
The offsets define the window relative to execution time, and then: “they do not account for ingestion delay. If events are still being ingested for the window you query, the query runs before they are available and skips them.”
Consider what the alarm sees. The query succeeds. It returns a number. The number is lower than the truth, by however many events had not landed yet. Nothing is missing, nothing errors, and no state tells you the count was partial — a metric filter never had this problem, because it counted events as they arrived rather than asking later whether they had.
AWS gives the arithmetic, for logs that take up to two minutes to become queryable. A 60-second lookback ending at execution time is the broken case, because “recent events are not yet ingested and are missed”. A 180-second lookback ending 120 seconds in the past is the working one, because “all events are ingested and evaluable”.
FixMeasure your ingestion delay for the log groups in question, then “Use EndTimeOffset to shift the window back far enough that ingestion is complete for the entire range”. You are trading detection latency for correctness, deliberately, and the trade is the right way round: an alarm two minutes late is an inconvenience, while an alarm reading a systematically low number is a monitoring system that lies in the reassuring direction.
Missing data on a Log Alarm has its own definition: “Missing data occurs when a scheduled query execution does not produce a value that can be evaluated against the threshold.” It covers “No logs present” and “Matching query results were not present as per the query filter”, and this: “The field referenced in the aggregation expression was not present in the query results. For example, count(error-codes) where error-codes does not exist in the returned log events.”
Then the exception that decides your alarm's behaviour: “Note that count(*) on an empty result set returns 0, which is a valid datapoint and is not treated as missing.”
Two queries, both meaning no errors in the last five minutes. One aggregates with
count(*) and produces a 0 that is compared against the threshold. The other
aggregates with count(someField) and produces missing data, handled by
TreatMissingData instead. Set that to breaching — the sensible
default from #111 — and a quiet period pages you. Set it to notBreaching and a
log group that has stopped receiving anything at all looks healthy.
Log Alarms support an ignore missing-data treatment that evaluates available query
results without treating missing executions as threshold breaches. CloudWatch metric alarms also
support an ignore setting, although its documented behavior is to retain the current
alarm state when datapoints are missing. The two alarm types should be evaluated according to
their respective missing-data rules.
Decide which of the two shapes you are writing. For sparse events, AWS's guidance is explicit: “For sparse events (such as errors that rarely occur), set TreatMissingData to notBreaching to keep the alarm in OK state when no logs match”, and “For continuous signals (such as traffic logs), consider setting TreatMissingData to breaching to detect when expected log data stops arriving.” Then make the aggregation match: count(*) when a zero is meaningful, a field aggregate when absence should be treated as absence.
“When you include a by clause in your aggregation expression, the alarm evaluates each unique combination of field values (called a contributor) independently”, and “The alarm transitions to ALARM state if any contributor breaches the threshold.” Three limits apply: “Maximum 5 fields in the by clause”, “Maximum 500 contributor results returned per query execution”, and “Maximum 100 contributors tracked in ALARM state simultaneously”.
The default ordering is the hazard: “By default, contributors are sorted alphabetically and only the first 500 are returned per query execution.”
On an estate with more than 500 services, endpoints or tenants, that means the set you evaluate is chosen by name. A latency alarm grouped by service name watches the ones early in the alphabet. The worst offender is evaluated if it happens to sort well. There is a signal — “PARTIAL_DATA – The query returned the maximum 500 contributor groups but more matched” — but it reports that the set was truncated, not that something outside it was breaching.
And one behaviour overrides your missing-data setting entirely: “If a contributor disappears from query results (for example, an ephemeral resource is terminated), that contributor transitions to OK state regardless of the missing data treatment setting.” #111's fix — treat absence as breaching — does not reach this case. A contributor that stops appearing is declared well.
FixSort by value, always, on any grouped alarm that could exceed the cap: “To sort contributors by their aggregated value instead, specify | sort asc or | sort desc in your aggregation expression”, because “Value-based sorting ensures that the most significant contributors are evaluated first when the total number exceeds 500.” Pick the direction that matches your comparison operator. Then alarm on PARTIAL_DATA appearing at all, because it means your grouping is too wide to see the whole estate.
Architecture
Metric filter or scheduled query: the same alarm, a different unit
| Metric filter plus metric alarm | Log Alarm | |
|---|---|---|
| When the question is decided | At ingestion, by the filter pattern | At evaluation, by the query |
| What a datapoint is | A published metric value | A query execution's aggregated result |
| Can you ask about a field nobody extracted | No — not retroactively | Yes — the query decides |
| Effect of ingestion delay | None — counted on arrival | Events can be skipped by a window that closed too early |
| What drives the bill | The alarm itself, “prorated by the hour” | The data each execution scans, on top of the alarm |
The fourth row is the architectural difference, not a quirk. Moving the evaluation downstream of ingestion buys you retrospective questions and inherits ingestion's timing.
M-out-of-N, when N is a count of query runs
The parameters read like a metric alarm's and mean something else: “QueryResultsToEvaluate is the number of recent query executions to evaluate (N in M-out-of-N)” and “QueryResultsToAlarm is the number of breaching results required to trigger ALARM (M in M-out-of-N)”, with “Log Alarms evaluate the last N query executions. The alarm transitions to ALARM when M of those N executions breach the threshold.”
So the evaluation window is measured in scheduled runs, and its wall-clock length is N multiplied by
your ScheduleExpression. Five executions on rate(5 minutes) is a
twenty-five-minute memory; five on rate(15 minutes) is over an hour. The same N means two
very different alarms, which is a thing to write in the alarm description rather than leave to the
reader of a dashboard.
The state reason spells the evaluation out, which is unusually legible for an alarm:
“Threshold Crossed: 3 out of the last 5 query results”, with each result's value
and timestamp, and a structured NewStateReasonData carrying
queryResultsToEvaluate, queryResultsToAlarm and a per-execution
status.
Three states that are not OK, ALARM or INSUFFICIENT_DATA
| EvaluationState | What happened | Where the alarm ends up |
|---|---|---|
EVALUATION_FAILURE |
“A transient CloudWatch service issue prevented evaluation” | INSUFFICIENT_DATA, with “manual monitoring until the issue is resolved” recommended |
EVALUATION_ERROR |
“A client configuration error prevented evaluation” — permissions, an invalid query, or all results failed | INSUFFICIENT_DATA “immediately” |
PARTIAL_DATA |
“The query returned the maximum 500 contributor groups but more matched” | Evaluates anyway, on the contributors it has |
The first two both land in INSUFFICIENT_DATA, which by #110's rules fires nothing. The
difference between them is whose problem it is, and the only place that distinction survives is the
EvaluationState field. A dashboard showing alarm state alone cannot tell a revoked
permission from a CloudWatch incident.
What it costs, and why the alarm-cost guidance does not cover it
CloudWatch's own cost documentation enumerates alarm types — metric alarms, Metrics Insights query alarms, composite alarms — and tells you “Costs for metric and composite alarms are prorated by the hour.” Log Alarms are not among the types that section describes, so check the pricing page for what the alarm itself carries. What is documented is the query's own line: the “DataScanned-Bytes” usage type against the “StartQuery” operation, listed as “Logs data scanned by CloudWatch Logs Insights queries”, and a Log Alarm runs one of those on every schedule tick.
That inverts the usual cost intuition. A metric alarm's cost is fixed and independent of how busy the
system is. A Log Alarm's cost is a product of three things you chose — the log groups, the
lookback window, and the schedule — multiplied by how much the system is logging. Halving the
interval doubles the executions; doubling StartTimeOffset doubles the range each one
reads; and a noisy day costs more than a quiet one.
Query design affects both performance and cost, but not every optimization reduces billable data
scanned. Limit the log groups and time ranges queried, and use supported field indexes and
filterIndex where appropriate to reduce scanning. Ordinary filter placement can improve
query processing without necessarily reducing Logs Insights scanning charges.
One account-level number that turns many alarms into one problem
“Concurrent query executions across your account cannot exceed 100.” With the instruction that follows it: “Spread out Log Alarm schedules across your account to avoid hitting Scheduled Query concurrency limits” and “Factor in this quota when creating multiple Log Alarms with overlapping schedules.”
Every Log Alarm on rate(5 minutes) created from the same template starts at the same
instant. The quota is shared with every other scheduled query in the account, including ones created
for reporting and lookup tables that have nothing to do with alarming. This is the failure that
arrives at scale rather than in testing, and the alarm it breaks is not the one you were adding.
Why This Architecture Holds Up
Removing the metric filter removes a decision made too early
A metric filter is a commitment made when the log group is created to the questions you will later be allowed to ask cheaply. Evaluating the query directly moves that commitment to the moment you have the question, which is the right place for it. The cost model follows honestly: you pay per question asked rather than per answer pre-computed.
The managed Scheduled Query has the right lifecycle
“CloudWatch automatically creates an AWS managed Scheduled Query that runs your query on the specified schedule”, it is visible in the Logs console, “You cannot modify it directly”, and “CloudWatch deletes the AWS managed Scheduled Query when you delete the alarm.” Visible, not editable, and garbage-collected with its owner — that is three correct choices, and the third is the one most managed sub-resources get wrong.
Multi-contributor alarms make the right action possible
“For multi-contributor alarms, Amazon SNS and Lambda actions run at the contributor level (once per breaching contributor). Systems Manager OpsItem actions run at the alarm level.” Per-contributor notification is what makes a grouped alarm actionable rather than merely informative, and keeping OpsItems at the alarm level avoids opening five hundred tickets. The gap is documented rather than discovered: “Systems Manager Incident Manager and investigation actions are not supported for Log Alarms.”
Key Architecture Decisions
| Decision | Choose this | Because |
|---|---|---|
EndTimeOffset |
Greater than your measured ingestion delay | The offsets “do not account for ingestion delay”, and skipped events return a low number, not a missing one |
| Aggregation shape when the answer is nothing happened | count(*) when a zero is the answer |
It “returns 0, which is a valid datapoint and is not treated as missing”; a field aggregate on an absent field is missing data instead |
TreatMissingData for sparse events |
notBreaching |
AWS's own guidance, to keep the alarm in OK when no logs match |
TreatMissingData for continuous signals |
breaching |
To detect when expected log data stops arriving — #111's rule, restated for logs |
| Grouped alarms above 500 contributors | Always append | sort desc or | sort asc |
The default is alphabetical, so without it the evaluated set is chosen by name rather than by severity |
| N in M-out-of-N | Set it from wall-clock tolerance, not from habit | N executions times the schedule is the real memory of the alarm |
| Schedules across the account | Stagger them deliberately | “Concurrent query executions across your account cannot exceed 100”, shared with every other scheduled query |
ActionLogLineCount |
Leave at 0 unless the log group is known to be clean | Log lines in notifications “might expose sensitive data from your logs in Amazon SNS messages” |
The audit worth running
Compare every Log Alarm's EndTimeOffset against the ingestion delay of its log
groups. Any alarm whose window ends at or near execution time is reading an incomplete range
on every run, and reporting a number that looks fine. This is the highest-value check here and it is
two configuration fields.
List the grouped alarms with no sort in their aggregation expression.
Each one is watching the alphabetically first 500 contributors. If any of them has ever reported
PARTIAL_DATA, it has already been looking at a subset chosen by name.
Count your scheduled queries, not just your Log Alarms. The concurrency quota is account-wide and shared with reporting and lookup-table queries, so the number that matters is not one a Log Alarm's own page will show you.
Check which alarms were updated recently. “When you update the query, aggregation expression, schedule, or log groups of a Log Alarm, the alarm transitions to INSUFFICIENT_DATA until sufficient new datapoints are collected” — so a routine query tweak creates a blind window whose length is N times the schedule. Threshold and M-out-of-N changes do not.
Closing Thought
The last three posts have each found a different way for a monitoring signal to be absent while a dashboard reads normal. #110: the alarm state that means I cannot tell. #111: a signal produced by the watcher, so its silence has two causes.
Log Alarms add a fourth case, and it is the quietest of them. Here the datapoint is present. It is a
number, produced by a query that succeeded, evaluated against a threshold exactly as designed. It is
simply lower than the truth, because the query asked at a moment when some of the evidence had not
finished arriving. There is no state for that, no EvaluationState, no partial flag —
only two offsets that you chose.
Which makes the design rule for this primitive different from the previous two. For a canary, you add
a second alarm. For a Log Alarm, you move the window: measure the ingestion delay and keep
EndTimeOffset behind it, accepting a known lag in exchange for a complete read. A
monitor that is late and right is a monitor. A monitor that is prompt and systematically low is a
source of confidence with nothing behind it.
Operational Excellence — CloudWatch Logs field indexes: what an index changes about which queries are cheap, when a query does not use one, and why the cost of asking a question is mostly a property of the log group's shape rather than of the question.
Official AWS Reference
- Log alarms — the definition of a Log Alarm and its managed Scheduled Query lifecycle, every configuration parameter including
StartTimeOffset,EndTimeOffset,QueryResultsToEvaluateandQueryResultsToAlarm, the ingestion-delay behaviour and its worked example, the missing-data definition and thecount(*)exception, the four treatments includingignore, the multi-contributor limits and alphabetical default ordering, theEVALUATION_FAILURE,EVALUATION_ERRORandPARTIAL_DATAstates, the disappearing-contributor behaviour, the account concurrency quota,ActionLogLineCountand its sensitive-data warning, and the unsupported Incident Manager actions - Analyzing, optimizing, and reducing CloudWatch costs — the
DataScanned-Bytesusage type againstStartQueryfor logs data scanned by Logs Insights queries, and the alarm cost model that covers metric, Metrics Insights and composite alarms - Alarming on logs — the two documented routes to an alarm on log data, the metric filter path and the Log Alarm path; no figures in this post are drawn from it
- Automating log analysis with scheduled queries — further reading on the Scheduled Query mechanism a Log Alarm creates and manages, and the three query languages it supports; no claims in this post are drawn from it
- CloudWatch Logs Insights language query syntax — further reading on the query language the alarm evaluates; no claims in this post are drawn from it
Comments