Business Challenge
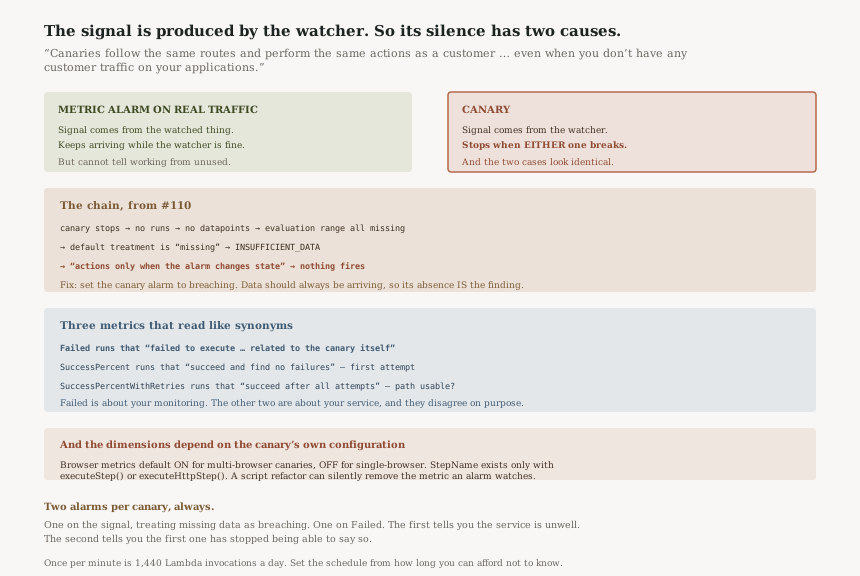
#110 established that an alarm with no data goes to INSUFFICIENT_DATA by default, and that INSUFFICIENT_DATA fires nothing. Canaries are where that behaviour does the most damage, because of what a canary is for.
“Canaries follow the same routes and perform the same actions as a customer, which makes it possible for you to continually verify your customer experience even when you don't have any customer traffic on your applications.”
That is the genuine capability: a metric alarm can only tell you about traffic that happened, so it cannot distinguish working from unused. A canary manufactures the traffic. The catch is that the canary is now the thing that has to keep working.
Canary metrics are a product of canary runs.
“By default, canaries create several CloudWatch metrics in the
CloudWatchSynthetics namespace”, and the metrics themselves are defined
per run — “Duration – The duration in milliseconds of the canary
run”, “SuccessPercent – The percentage of the runs of this
canary that succeed and find no failures”.
So a canary that is stopped, paused, throttled, broken on a bad deployment of its own script, or
sitting behind an expired IAM role emits no new datapoints. Follow that into #110's rules: the
evaluation range fills with missing data, the default treatment is
“missing”, and
“If all data points in the alarm evaluation range are missing, the alarm transitions to
INSUFFICIENT_DATA.” Since
“An alarm invokes actions only when the alarm changes state”, the ALARM action
never fires.
The result is a dashboard on which a stopped canary and a perfectly healthy service are the same picture. Worse than a false negative, because a false negative at least implies something was measured.
FixSet the canary alarm's missing-data treatment to breaching — “Missing data points are treated as “bad” and breaching the threshold”. For a synthetic monitor this is almost always right: the whole point is that data should always be arriving, so its absence is itself the finding. Then add a second alarm on Failed, which catches the different failure in challenge 2.
Two metrics that read like synonyms and are not:
“Failed – The number of canary runs that failed to execute.
These failures are related to the canary itself.”
“SuccessPercent – The percentage of the runs of this canary that
succeed and find no failures.”
Failed counts the canary breaking. SuccessPercent counts runs that
completed and found nothing wrong. A script with a syntax error after an update, a canary
whose Lambda times out, a broken dependency in its own layer — those move
Failed, and they are statements about your monitoring, not about your service. Alarming
on one and reporting it as the other is how a monitoring outage gets filed as an application
incident, or the reverse.
There is a third reading of the same run:
“SuccessPercentWithRetries – The percentage of the runs of this canary
that succeed after all attempts”, with
“RetryCount – The number of times your canary retried. This metric is
only displayed when there are retries.” A path that fails and then succeeds on retry
scores badly on SuccessPercent and perfectly on
SuccessPercentWithRetries. Both numbers are true; they answer different questions, and
the second is the more forgiving one to put on a slide.
Alarm on all three deliberately and label them for what they measure: Failed as monitoring is broken, SuccessPercent as first attempt failed, SuccessPercentWithRetries as the path is unusable. Which one belongs in your SLO is a real decision — a customer who succeeds on a browser retry had a worse experience than the retried number suggests and a better one than the raw number does.
An alarm names a metric and its dimensions. For canaries, which dimensions exist is not fixed:
“For multi-browser canaries, browser-dimension metrics are enabled by default to provide
visibility into performance across browsers like Chrome, Firefox and other browsers.”
And the inverse: “For single-browser canaries, browser-dimension metrics are disabled by
default to avoid redundancy. To see metrics broken down by browser, set
browserDimension to true.”
Step-level dimensions are conditional too:
“Canaries that use either the executeStep() or
executeHttpStep() methods from the Synthetics library also publish
SuccessPercent and Duration metrics with the dimensions
CanaryName and StepName for each step.”
So an alarm written against a Browser or StepName dimension depends on a
property of the canary's script and configuration. Convert a multi-browser canary to
single-browser, or refactor a script away from executeStep(), and the dimension stops
being published. #110 covers what happens next: no datapoints, INSUFFICIENT_DATA, no action —
and nothing in CloudWatch objects to an alarm on a dimension that no longer exists.
Alarm on the CanaryName dimension for the signal that must never go quiet, and treat Browser and StepName alarms as additional detail rather than the primary guard. If a script refactor is in scope, check the alarms that reference its step names in the same change — they are coupled to the code, and nothing links them.
Architecture
What a canary proves that a metric alarm cannot
| Metric alarm on real traffic | Canary | |
|---|---|---|
| Needs customers | Yes — no traffic, no signal | No — “even when you don't have any customer traffic” |
| Can distinguish working from unused | No | Yes |
| Covers the whole path | Only the hops that emit metrics | End to end, as the customer sees it |
| What goes quiet when it breaks | Nothing — the service is still emitting | The signal itself |
The last row is the trade. A metric alarm's signal is produced by the thing being watched, so it keeps arriving while the watcher is fine. A canary's signal is produced by the watcher, so it stops when either one breaks — and the two cases are indistinguishable without a second alarm.
Three readings of one run
| Metric | What it counts | What it is a statement about |
|---|---|---|
Failed |
Runs that “failed to execute” | Your monitoring — “related to the canary itself” |
SuccessPercent |
Runs that “succeed and find no failures” | The first attempt against your service |
SuccessPercentWithRetries |
Runs that “succeed after all attempts” | Whether the path is usable at all |
Failed requests |
“HTTP requests executed by the canary on the target website that failed with no response” | Individual requests, not runs |
Failed requests is the one most likely to be misread, because it counts requests rather
than runs and it is scoped to no response — a 500 is not a failed request by this
definition, it is a 5xx.
What else a canary can watch
Beyond availability and latency, canaries can compare what the page looks like:
“VisualMonitoringSuccessPercent – The percentage of visual comparisons
that successfully matched the baseline screenshots during a canary run.” And the broader
claim: “Canaries check the availability and latency of your endpoints and can store load time
data and screenshots of the UI.”
Visual monitoring is the capability with no metric-alarm equivalent at all. A service can return 200 with correct latency and a blank page, and nothing in a conventional metric notices. It is also the capability most likely to produce alarm fatigue, because a baseline that drifts with every legitimate design change needs maintaining.
The cost shape, which follows from the schedule
“Canaries can run as often as once per minute” — 1,440 runs a day, each one a Lambda invocation, because “They create Lambda functions in your account that use Node.js, Python, or Java as the runtime.” A headless-browser canary is not a cheap Lambda, and the artefacts it stores accumulate in S3.
So the per-minute schedule that makes a canary responsive is also the one that makes it the most expensive monitoring you own per signal. The useful question is not how often can it run but how long are you willing not to know, which for most paths is longer than a minute.
Why This Architecture Holds Up
Manufacturing the traffic is the only way to answer the question
There is no passive way to know whether an unused path works. Either you wait for a customer to find out, or you generate the request yourself. Synthetics takes the second option honestly, and the consequence — that the monitor becomes a component with its own failure modes — is inherent rather than a design flaw.
Separating Failed from SuccessPercent is the right distinction
It would have been easier to publish one success number and let canary failures contaminate it. Keeping “failures … related to the canary itself” in a separate metric is what makes it possible to tell a monitoring outage from an application outage at all. The names could be clearer; the separation is correct.
Running on your own Lambda is a defensible trade
Canaries execute in your account, with your IAM role, in your VPC if you choose. That makes them debuggable and lets them reach private endpoints, at the price of being your Lambda to keep working. A fully managed prober could not reach anything private.
Key Architecture Decisions
| Decision | Choose this | Because |
|---|---|---|
| Missing-data treatment on a canary alarm | breaching |
Data should always be arriving, so its absence is the finding — the default sends it to INSUFFICIENT_DATA instead |
| Detecting a broken canary | A separate alarm on Failed |
Those failures are “related to the canary itself” and say nothing about the service |
| Which success metric goes in the SLO | Decide explicitly, and say which | SuccessPercent and SuccessPercentWithRetries answer different questions |
Alarming on Browser or StepName |
Treat as detail; guard on CanaryName |
Those dimensions depend on the canary type and the script's functions |
| Refactoring a canary script | Review the alarms naming its steps in the same change | Step dimensions are coupled to the code and nothing links them |
| Run frequency | Set it from how long you can afford not to know | Once a minute is 1,440 Lambda invocations a day per canary |
| Visual monitoring | Adopt where a blank page is a real risk | No metric alarm detects a 200 with broken rendering — but baselines need maintaining |
The audit worth running
Check the missing-data treatment on every canary alarm. If it is the default, that alarm cannot tell you the canary stopped. This is the single highest-value check in this post and it is a configuration field.
Then confirm something alarms on Failed. Without it, a canary that
breaks on its own script update is invisible, and the service it was watching is now unmonitored with
a green dashboard.
Finally, list your canary alarms by dimension. Anything on Browser or
StepName is coupled to a configuration or a function name that a routine change can
remove. Those are the alarms most likely to be quietly watching a metric that no longer exists.
Closing Thought
This run of posts has circled one idea from several directions: a signal's absence is not the same as a signal of health, and most dashboards render them identically. #105 had an index that answered partially. #108 had a compliance status that was an estimate. #110 had the alarm state that means I cannot tell.
Canaries are the sharpest form of it, because here the absence is produced by the monitor rather than the system. Every other signal in this series degrades when the thing being watched degrades. A canary's signal degrades when either the service or the canary degrades, and the two look the same from outside. That is not an argument against canaries — they answer a question nothing else can — it is an argument for the second alarm.
So, two alarms per canary, always: one on the signal, treating missing data as breaching, and one on
Failed. The first tells you the service is unwell. The second tells you that the first one
has stopped being able to say so.
Operational Excellence — CloudWatch Logs Insights and log-based alarms: why a query that runs on a schedule is a different monitoring primitive from a metric filter, what an M-out-of-N evaluation means when the datapoints are query executions, and what it costs to alarm on data you have to scan.
Official AWS Reference
- CloudWatch metrics published by canaries — the exact definitions of
Failedas runs that failed to execute and related to the canary itself,SuccessPercent,SuccessPercentWithRetries,Failed requests,RetryCount,DurationandVisualMonitoringSuccessPercent, the browser-dimension defaults for multi- and single-browser canaries, and the conditionalStepNamedimension - Synthetic monitoring (canaries) — that canaries verify customer experience without customer traffic, that they create Lambda functions in your account, the once-per-minute floor on scheduling, the
CloudWatchSyntheticsnamespace andCanaryNamedimension, availability and latency checking with stored screenshots, and Region availability - Configuring how CloudWatch alarms treat missing data — that the default treatment is
missingand sends an all-missing evaluation range to INSUFFICIENT_DATA, and thatbreachingtreats absent points as breaching, which is the fix for a canary alarm - Using Amazon CloudWatch alarms — that an alarm invokes actions only when it changes state, which is why an alarm sitting in INSUFFICIENT_DATA delivers nothing
- Security considerations for Synthetics canaries — further reading before running canaries against production endpoints; no claims in this post are drawn from it
Comments