Executive summary
ECS now offers blue/green, linear and canary deployments for services using VPC Lattice, “enabled for both new and existing ECS services in all AWS Regions where VPC Lattice is available.”
The capability itself is unsurprising and welcome: Lattice joins ALB, NLB and Service Connect as a traffic-shifting resource, so the same three primitives apply — a target group, a listener and a rule are each “an Elastic Load Balancing or VPC Lattice resource”. If your service-to-service traffic already runs through Lattice, you no longer have to put a load balancer in front of it just to deploy safely.
What is worth the post is the configuration surface underneath, because two of its documented ranges multiply into a third documented limit and overshoot it.
What changed
Four strategies now, “ROLLING | BLUE_GREEN | LINEAR | CANARY”, with the newer three differing only in how traffic moves:
| Strategy | Traffic movement | Config object |
|---|---|---|
BLUE_GREEN |
All at once, after a bake | bakeTimeInMinutes — “You must provide this parameter” |
LINEAR |
Equal increments with a wait between each | linearConfiguration — only valid for LINEAR |
CANARY |
“a small percentage… then shifts the remaining traffic all at once” | canaryConfiguration — only valid for CANARY |
And Lattice slots in at the testing phase as well as the shifting phase: “Your traffic-shifting resource (an Application Load Balancer, Network Load Balancer, Service Connect, or VPC Lattice) directs test requests to the green environment while production traffic remains on blue.” The test-traffic path is the part people under-use, and it is available before a single production request moves.
Architecture
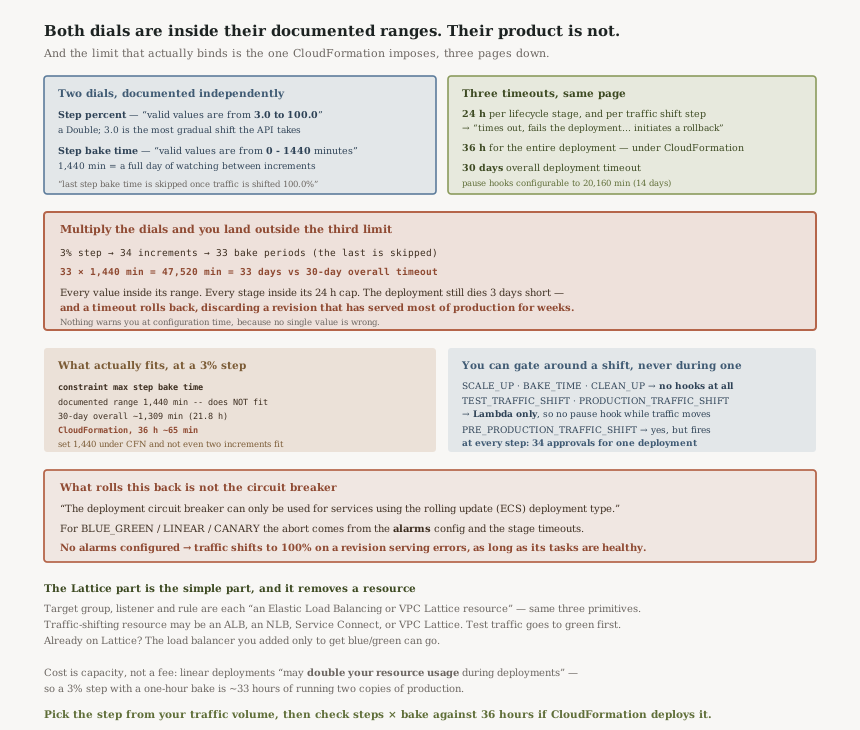
Two dials, documented independently
“Step percent — The percentage of traffic to shift in each increment during a linear deployment. This field takes Double for value, and valid values are from 3.0 to 100.0.”
“Step bake time — The duration to wait between each traffic shift increment during a linear deployment. Valid values are from 0 - 1440 minutes.”
Both are legitimate. A 3% step is the most gradual shift the API will take, and 1,440 minutes is a full day of observation between increments — which is exactly what someone deploying something frightening would reach for.
And three timeouts, on the same page
“Each lifecycle stage can last up to 24 hours and in addition each traffic
shift step in PRODUCTION_TRAFFIC_SHIFT can last upto 24 hours… The
system times out, fails the deployment, and then initiates a rollback after a stage
reaches 24 hours.”
“While the 24-hour stage limit remains in effect, CloudFormation enforces a 36-hour limit on the entire deployment.”
“For pause hooks, you can configure the timeout up to 20,160 minutes (14 days). The overall deployment timeout is 30 days.”
Multiply the dials and you land outside the third limit
A 3% step needs 34 increments to reach 100%, and the waits sit between them — “Note, that last step bake time is skipped once traffic is shifted 100.0%” — so 33 bake periods.
At the maximum step bake time that is 33 × 1,440 = 47,520 minutes, which is 33 days. The overall deployment timeout is 30 days.
So the most cautious linear deployment the API will accept cannot complete. Every individual value is inside its documented range, each stage is inside its 24-hour cap, and the deployment still dies three days short of the end — and what it does on timeout is roll back, which at that point means discarding a revision that has been serving a majority of production traffic for weeks.
| Constraint | Bake periods | Max step bake time that fits |
|---|---|---|
| Documented range | 33 | 1,440 min — does not fit |
| 30-day overall timeout | 33 | ~1,309 min (21.8 h) |
| CloudFormation, 36 h total | 33 | ~65 min |
The CloudFormation row is the one that will actually bite, because most people deploy ECS services from a template rather than from the API. Thirty-six hours for the entire deployment, spread across 33 increments, is about 65 minutes of observation per step. Set 1,440 and not even two increments fit inside the limit.
Business value
Two things, and the smaller one is the cleaner win. If your service-to-service traffic already runs through Lattice, you have until now needed a load balancer in front of it purely to get a managed deployment strategy — an extra resource, an extra hop and an extra bill that existed for the benefit of the deploy rather than the request path. That resource can go.
The larger one is that traffic shifting becomes available on the substrate where cross-VPC and cross-account calls already live. The strategies are the same ones ECS offers elsewhere, so this is not a new capability to learn — it is an existing capability reaching the place a service mesh put your traffic.
Security considerations
Nothing here changes who can call what; the authorisation model for Lattice is unchanged. What changes is the exposure window during a release, and it changes in a good direction: the test-traffic path runs first and separately, so a new revision can be exercised end-to-end before a single production request reaches it. “Your traffic-shifting resource… directs test requests to the green environment while production traffic remains on blue.”
The thing worth gating deliberately is the pause hook. A pause hook is a human holding a deployment open,
and it waits for someone to call ContinueServiceDeployment — so whoever
holds that permission decides when a release proceeds. Scope
ecs:ContinueServiceDeployment like the approval step it is, not like a
read-only deployment action.
And one failure mode is a security matter rather than a reliability one: a linear deployment with no
alarms configured will shift to 100% on a revision that is serving errors, so
long as its tasks are healthy. If the new revision has a broken authorisation path, task health will not
notice.
Lifecycle hooks are uneven, and unevenly in the places you want them
Eleven stages, and the hook support column is the thing to read before designing a gate:
| Stage | Hook support | What it means |
|---|---|---|
PRE_SCALE_UP, POST_SCALE_UP | Yes | Lambda or pause, before any traffic moves |
SCALE_UP | No | Green launching tasks; nothing can gate it |
TEST_TRAFFIC_SHIFT | Lambda only | No pause hook while test traffic migrates |
PRE_PRODUCTION_TRAFFIC_SHIFT | Yes | “invoked at every traffic shift step” |
PRODUCTION_TRAFFIC_SHIFT | Lambda only | No pause hook while production traffic moves |
BAKE_TIME, CLEAN_UP | No | No gate before the blue revision is torn down |
The pattern is consistent: you can gate around a traffic shift but not during one. A
pause hook — which “pause[s] the deployment and wait[s] for you to call
ContinueServiceDeployment to proceed” — belongs on
PRE_PRODUCTION_TRAFFIC_SHIFT, and that one fires
“at every production traffic shift step”.
Which is worth doing the arithmetic on too: a pause hook on that stage at 3% steps means 34 manual approvals for one deployment. It is a per-step hook, not a per-deployment one.
And BAKE_TIME and CLEAN_UP supporting no hooks
means there is no programmatic last look before the old revision scales to zero. The bake time itself is
the only thing standing between a bad release and an irreversible one.
What rolls this back is not the circuit breaker
The announcement mentions circuit-breaker integration, and the API reference is narrower about where the
circuit breaker applies: “The deployment circuit breaker can only be used for services using
the rolling update (ECS) deployment type.”
For the three traffic-shifting strategies the rollback path is the alarms
configuration plus the stage timeouts — the monitoring phase is described as
“Monitor application health, performance metrics, and alarm states during the bake time period.
A rollback operation is initiated when issues are detected”, and the 24-hour stage cap
“times out, fails the deployment, and then initiates a rollback” on its own.
Worth being precise about, because the two mechanisms behave differently. The circuit breaker reacts to tasks failing to reach steady state; CloudWatch alarms react to whatever you told them to watch. A linear deployment with no alarms configured has no automatic failure detection during traffic shifting at all — it will shift all the way to 100% on a revision that is serving errors, as long as its tasks are healthy.
That is the same shape as #37,
which found that ECS rollback targets the most recent COMPLETED deployment and
can strand itself when there isn't one. Deployment safety here is a set of things you configure, not a
property you get.
Cost considerations
No charge is stated for the capability, and the real cost is capacity: “Linear deployments temporarily run both the blue and green service revisions simultaneously, which may double your resource usage during deployments.”
Combine that with the timing arithmetic and the bill becomes a function of your caution. A 3% step with a one-hour bake is about 33 hours at double capacity. The same service deployed blue/green with a 30-minute bake is about half an hour. Choosing the gentlest strategy is choosing to run two copies of production for a day and a half.
That is the trade to state plainly rather than discover: linear deployments buy confidence with capacity and wall-clock time, and both scale with the number of steps.
Operational considerations
The deployment now has a duration you have to plan around. A rolling update finishes in minutes. A linear deployment with 33 increments and an hour between each runs for a day and a half, with both revisions live throughout. That changes what a change-freeze window means and what "deploy on Friday" costs.
Stage timeouts fail closed, and they fail late. Each stage caps at 24 hours and “times out, fails the deployment, and then initiates a rollback”. A pause hook nobody answers therefore does not sit there indefinitely — it burns a day and then reverts, which is the right default and a surprising one if you expected it to wait.
Know which path deploys the service. CloudFormation's 36-hour ceiling on the whole deployment is far tighter than the 30-day API ceiling, so the same configuration behaves differently depending on whether a template or a direct API call drove it. That is the single most important operational fact in this release.
Pause-hook timeouts are generous enough to be dangerous. Configurable “up to 20,160 minutes (14 days)” against a 24-hour stage cap — so a pause hook can be configured to wait far longer than the stage it sits in will survive.
Tradeoffs
| Strategy | Buys you | Costs you |
|---|---|---|
ROLLING |
Speed, and the deployment circuit breaker | No traffic-percentage control; no test-traffic phase |
BLUE_GREEN |
One bake, one cutover, fast rollback | Full exposure the moment traffic moves |
CANARY |
A small exposed population, then one cutover | Only two exposure levels, so a problem that scales with load may not appear in the canary |
LINEAR |
Graduated exposure with a gate between each step | Double capacity for the whole run, wall-clock measured in hours or days, and a product that has to fit inside three timeouts |
The axis nobody states is that caution costs capacity multiplied by time, and linear deployments scale both with the number of steps. A 3% step is not 33 times safer than a 100% step; it is 33 times longer and twice as expensive throughout.
Implementation guidance
Pick the step percent from your traffic volume, not from your nerves. The point of a small step is to expose the new revision to enough requests to see a problem. If 3% of your traffic is forty requests a minute, a 3% step tells you almost nothing and costs you 33 waits.
Then check the product against your deployment path. Steps × step bake time has to fit inside 36 hours if CloudFormation drives the deployment, and inside 30 days otherwise. There is nothing that warns you at configuration time — both values are individually valid.
Configure alarms. Without them, traffic shifting has no
automatic abort, and the circuit breaker is not available for these strategies.
Put pause hooks on PRE_PRODUCTION_TRAFFIC_SHIFT only if you mean it
per step. For a single human gate, use POST_TEST_TRAFFIC_SHIFT
— after the green revision has taken 100% of test traffic and before any production request moves.
If you already run Lattice, drop the load balancer you added for deployments. That is the actual win in this announcement: the traffic-shifting primitives are now the same three objects on either substrate.
Best practices
Derive the step percent from request volume, not from anxiety. A step is only a test if enough traffic crosses it to surface a fault. Below a few hundred requests per increment you are paying in hours for a sample that cannot tell you anything.
Compute steps × step bake time and compare it against your deployment path's ceiling — 36 hours under CloudFormation, 30 days otherwise. Make it a check in CI if you template ECS services, because nothing in the API will do it for you.
Always configure alarms. For these strategies they are the
only automatic abort; the circuit breaker is not available. An alarm on target-group 5xx and on the
service's own error metric is the minimum that makes graduated exposure mean anything.
Put the human gate at POST_TEST_TRAFFIC_SHIFT, not at
PRE_PRODUCTION_TRAFFIC_SHIFT. The first is one approval after the
green revision has taken all test traffic; the second fires at every step.
Use Lambda hooks for the per-step checks and keep them fast.
TEST_TRAFFIC_SHIFT and PRODUCTION_TRAFFIC_SHIFT
accept Lambda only, so automated validation is the only thing that can run while traffic is actually
moving.
Drop the load balancer you added only to enable deployments once the Lattice path is proven. That is the concrete saving in this release.
Who should adopt this
Anyone running ECS services behind VPC Lattice can now use the managed strategies directly, on existing services, with no migration.
Anyone already using LINEAR with a small step and a long bake
should multiply the two numbers today and compare against 36 hours if the service is deployed by
CloudFormation. This is the item here that can already be configured wrong.
Anyone who added an ALB purely to get blue/green on a Lattice-fronted service can remove it.
Key takeaways
Lattice becoming a traffic-shifting resource is a clean, uncomplicated addition, and it removes a load balancer that existed only to enable deployments.
The thing to carry away is about limits rather than about Lattice: stepPercent
and stepBakeTimeInMinutes are documented independently, and their product is
bounded by a third number documented further down the same page. At the extremes the API accepts a
configuration that runs 33 days against a 30-day ceiling, and under CloudFormation the real ceiling is 36
hours for everything.
Which is the same failure the last two posts found from different directions — today's #71 is about defaults that are individually reasonable and collectively expensive. Here the values are individually valid and collectively impossible. Nothing checks the combination but you.
Official AWS references
- Amazon ECS adds Amazon VPC Lattice support for blue/green, linear, and canary deployments — the announcement and Region availability
- Amazon ECS linear deployments — step percent and step bake time ranges, the eleven lifecycle stages and their hook support, and the stage, CloudFormation and overall timeouts
- DeploymentConfiguration — the four strategy values, the per-strategy configuration objects, and the circuit breaker restriction
Comments