📋 In This Post
- Why — The Problem This Solves
- Choosing the Right Approach
- Architecture — How It Fits Together
- Step 1 — Enable CUR 2.0 Export
- Step 2 — Data Pipeline: S3, Glue, Athena
- Step 3 — Identity & Security (No IAM Users)
- Step 4 — Lambda & API Gateway
- Step 5 — React Dashboard on CloudFront
- What the Dashboard Shows
- Challenges & Real Bugs Fixed
- Cost to Run
- Switching to Real CUR Data (3 Steps)
- What Phase 2 Adds
- Key Takeaways
Why — The Problem This Solves
EBS volumes are one of the most reliably wasteful line items in any AWS bill — not because engineers are careless, but because the cost is invisible until someone actively looks for it.
In a typical enterprise AWS org with 500 accounts:
- Unattached volumes keep billing after the EC2 instance they served is terminated
- gp2 volumes never migrated to gp3 cost 20% more for identical throughput
- io1 volumes provisioned for peak workloads sit idle at $0.125/GB-month
- Snapshots pile up automatically and are never reviewed
QuickSight and Cost Explorer show you what you spent — not what you could stop spending. They cannot cross-reference which volumes are unattached right now, or project savings if you take action today. QuickSight also requires per-user licensing starting at $18/user/month.
I wanted a single dashboard that answers three questions at once:
- How much are we spending on EBS across the entire org right now?
- Which accounts and regions are the biggest offenders?
- What is the projected saving if we clean up unused volumes and migrate gp2 → gp3?
FinOps teams get a monthly savings target with account-level breakdown. Platform teams get evidence to justify cleanup automation. Engineers get out of the loop — the data is always current, no one needs to run a script to answer a cost question.
Choosing the Right Approach
There are several ways to build cost visibility tooling on AWS. Here is how the main options compare:
Shows billing history well. Cannot cross-reference live EC2 inventory or project savings. QuickSight licensing starts at $18/user/month.
Comprehensive but $10k–$100k+/year. Adds external vendor dependency with data egress. Overkill for a focused EBS workflow.
Reads your own billing data from your own S3 bucket. No licensing. Permanent CloudFront URL. ~$0–2/month. Fully customisable. Phase 2 adds live EC2 inventory on top.
Billing data only — cannot call EC2 APIs to check attachment status. Per-user licensing still applies.
The CUR 2.0 → Athena path wins because the data is already in your S3 bucket (AWS delivers it daily), Athena charges only for columns scanned ($5/TB), and the whole pipeline is serverless — nothing running when nobody is using it.
This post covers Phase 1 only — CUR billing data, no live EC2 API calls. Phase 2 will add cross-account EC2:DescribeVolumes via STS AssumeRole to show live attachment status per volume.
Architecture — How It Fits Together
Three swim lanes, entirely serverless, no persistent compute:
- ① Data Pipeline — CUR 2.0 Parquet lands in S3. Glue Catalog provides the schema. Athena queries the data. Results cached in a second S3 bucket for 3 days.
- ② API Layer — API Gateway triggers Lambda on every dashboard load. Lambda runs as an IAM Role with least-privilege permissions — no IAM users, no access keys anywhere.
- ③ Frontend — React app compiled and synced to a private S3 bucket. CloudFront serves it globally via OAC. Permanent HTTPS URL, free
*.cloudfront.netcertificate.
Step 1 — Enable CUR 2.0 Export
Everything starts here. CUR 2.0 is the billing export AWS delivers daily to an S3 bucket in Parquet format. It must be enabled from the management (payer) account — not a member account. Go to Billing → Data Exports → Create export.
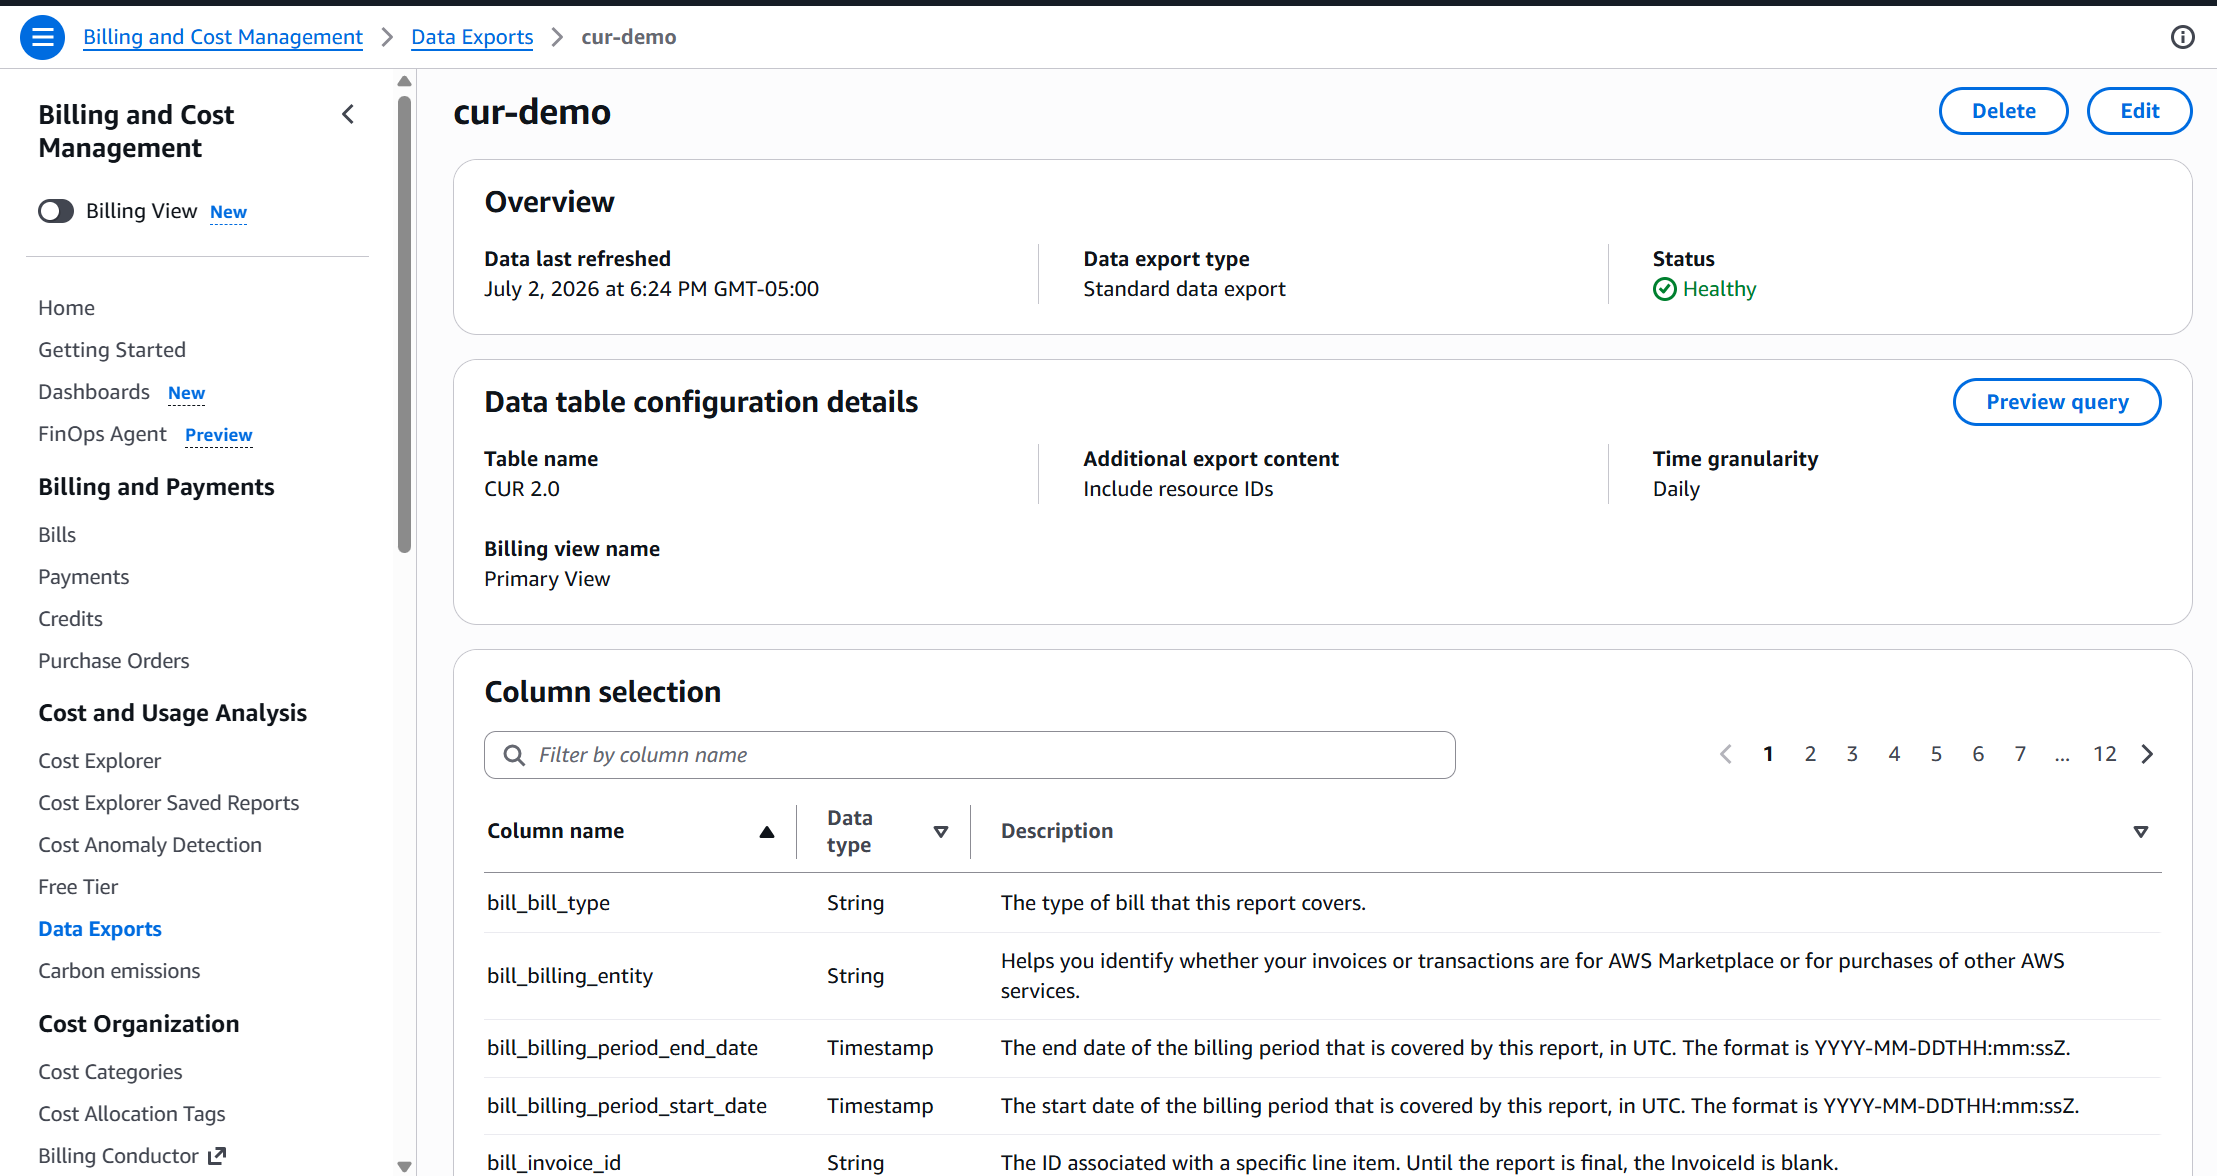
The critical selections:
- Include Resource IDs — required. This is the EBS volume ID (
vol-xxxxxxxx) - Time granularity: Daily — not Hourly (24x more rows with zero benefit for monthly savings tracking)
- File versioning: Create new file — not Overwrite. You want historical months preserved so the trend chart has data to show
- Amazon Athena checked — AWS auto-creates the Glue Catalog table and Hive partitions. No Glue Crawler needed in production
- Parquet format — columnar, Snappy-compressed. Athena scans only the columns your SQL touches, not all 116
Athena only charges for columns it actually scans. Your SQL selects ~8 columns. The other 108 cost nothing. Removing columns now means you can't add them back later without losing historical data.
Step 2 — Data Pipeline: S3, Glue, Athena
Once CUR is configured, AWS delivers one Parquet file per billing period to your S3 bucket. For Phase 1 testing I generated 18 months of synthetic data using generate_mock_cur.py — simulating 500 accounts, 6 regions, and ~5,000 EBS volumes. This lets the full pipeline be validated before waiting 24 hours for real CUR delivery.
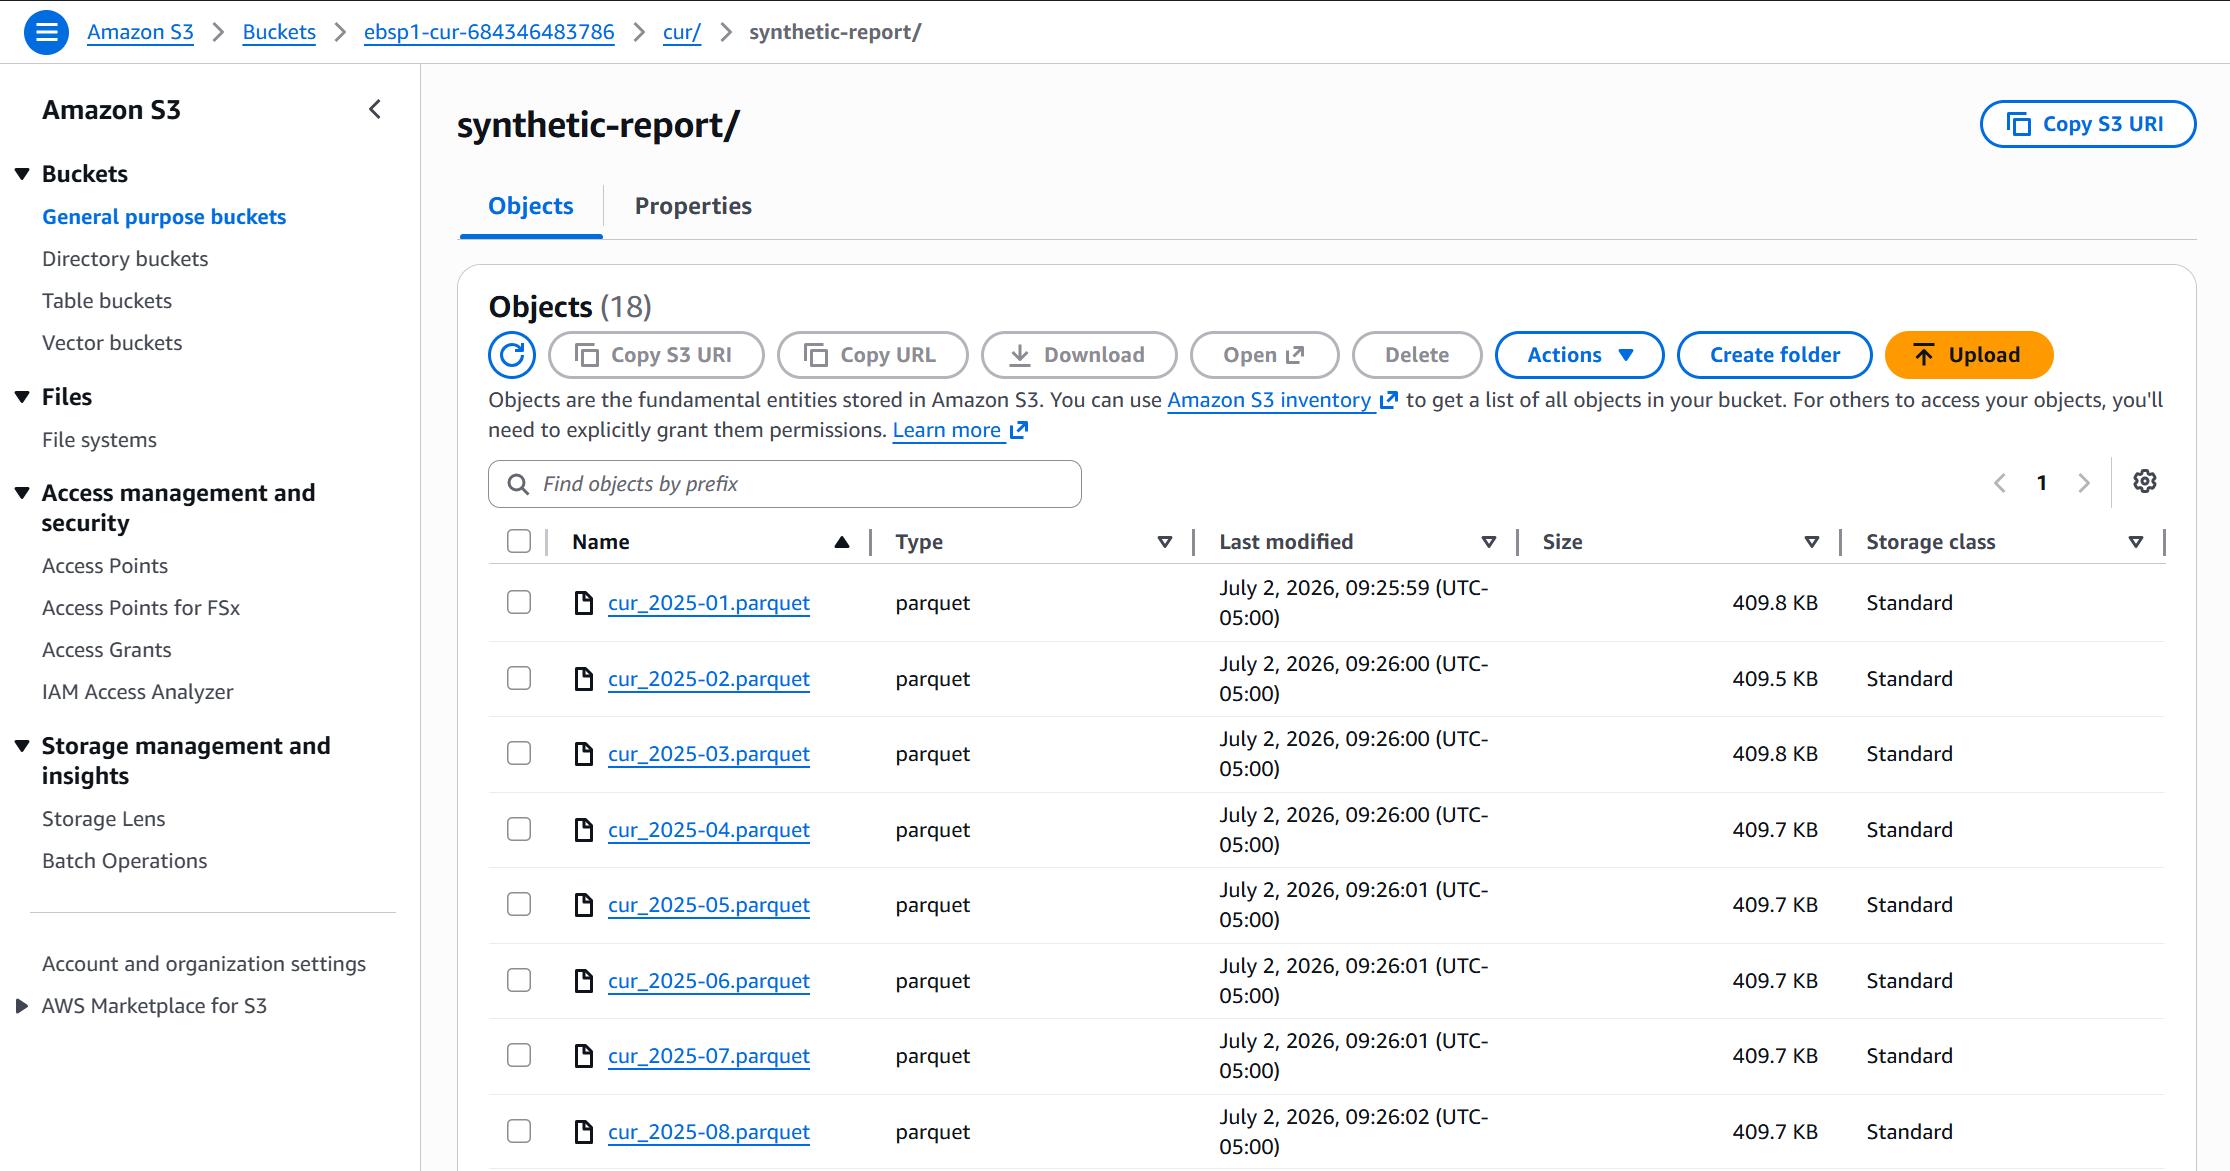
A Glue Crawler reads the bucket and registers the schema in the Glue Data Catalog. Athena then uses that catalog to query the files with SQL — without needing to know the physical file paths.
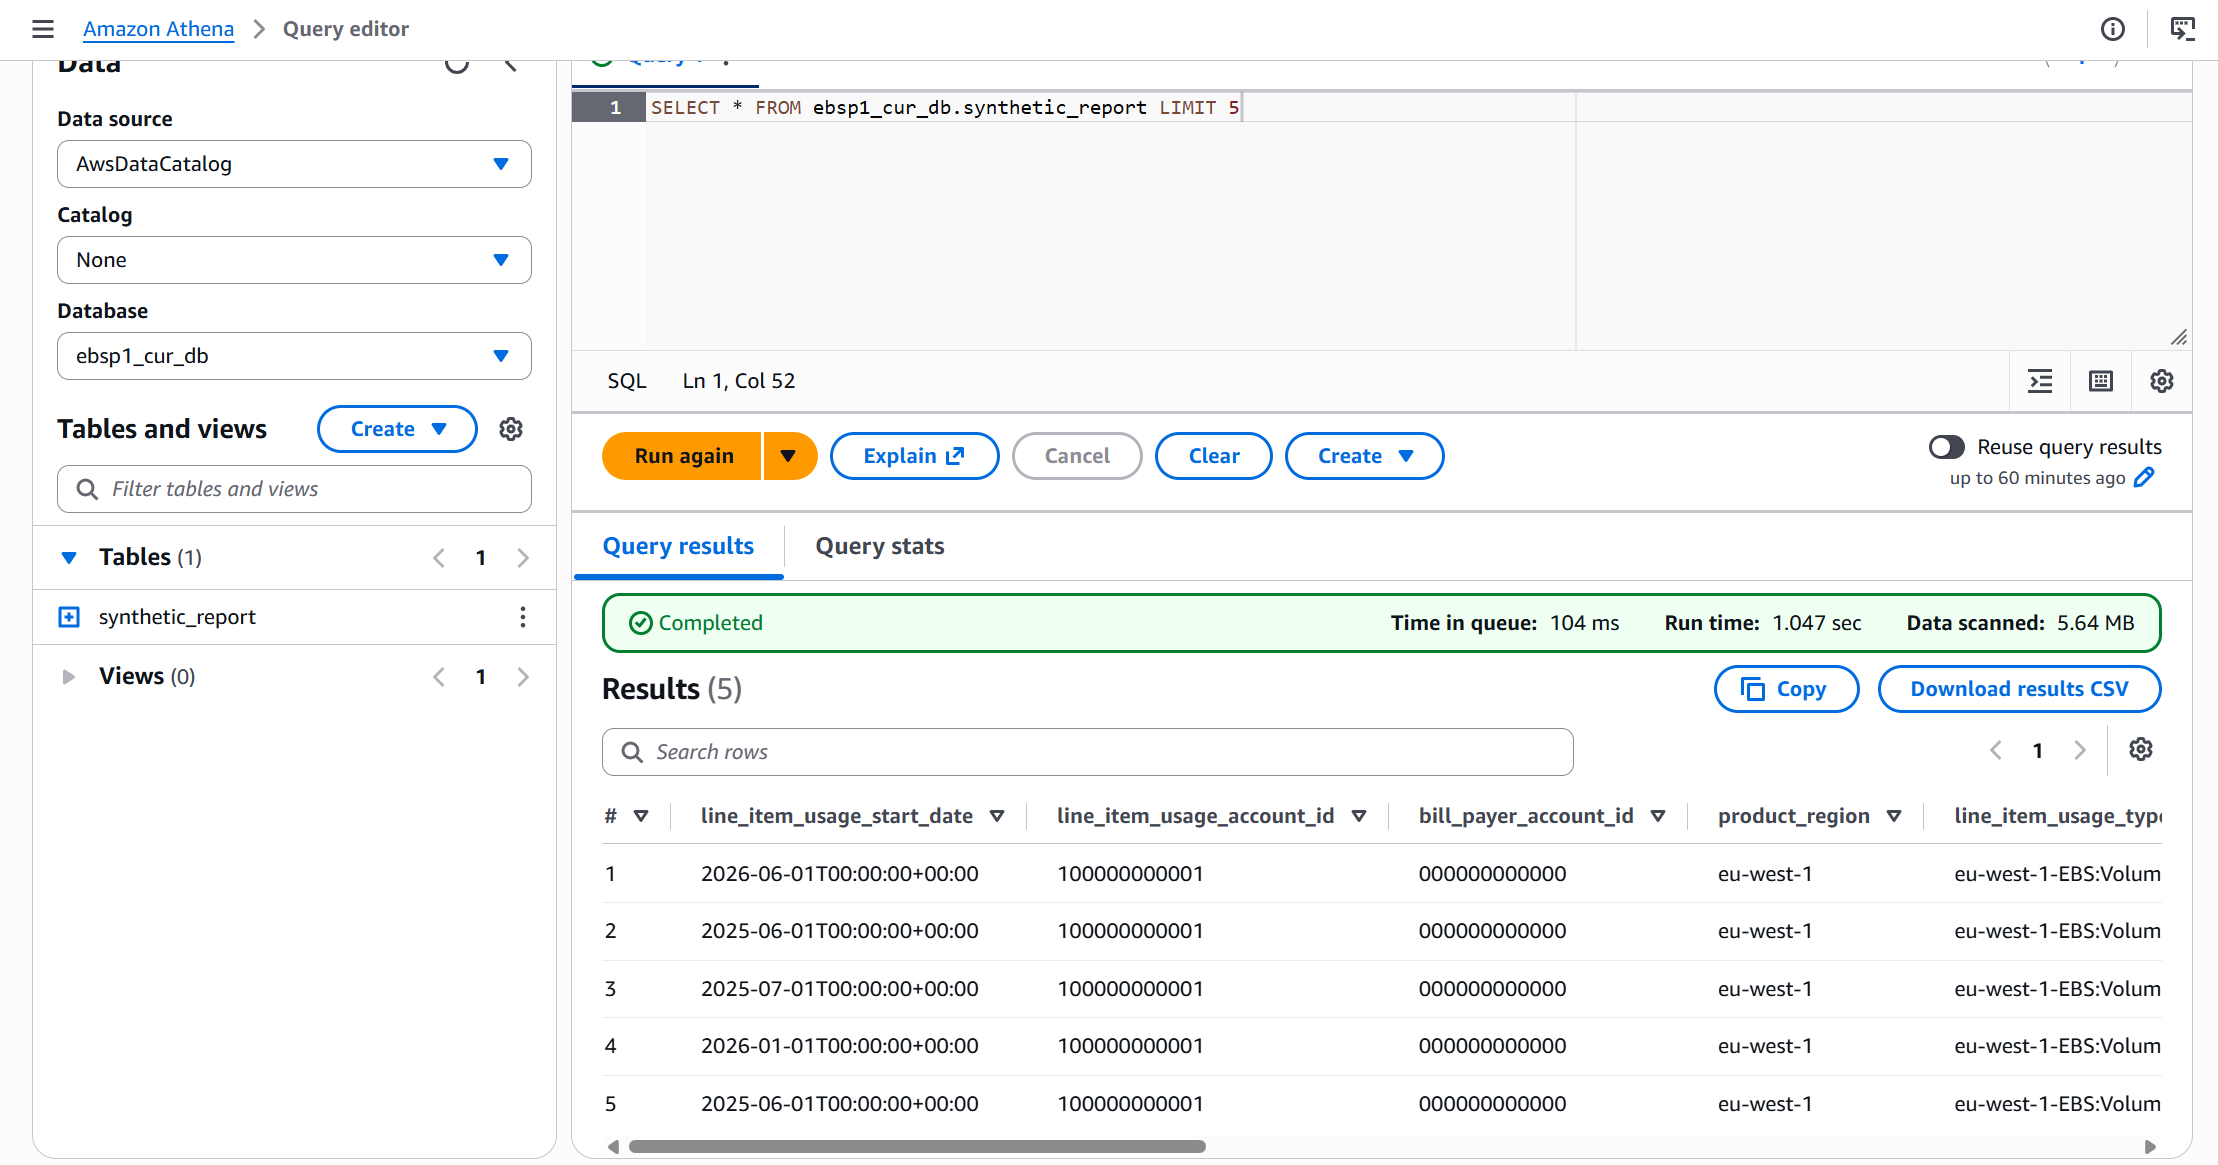
synthetic_report table is visible in the left panel. Running a LIMIT 5 query shows the actual column names and data your Lambda readsColumn names like line_item_usage_account_id, line_item_unblended_cost, and product_regioncode are standardised by AWS — identical across every company, every account, every region worldwide. Write the SQL once and it works in any AWS org.
The Lambda filters to EBS-only rows using:
WHERE line_item_product_code = 'AmazonEC2'
  AND line_item_usage_type LIKE '%EBS:VolumeUsage%'
This skips EC2 instances, RDS, and every other service in the same CUR file — returning only EBS volume cost rows.
Athena Query Result Reuse
CUR data only updates once per day. Running a fresh Athena scan every time someone opens the dashboard is wasteful. Athena's Query Result Reuse returns cached results at $0 cost if the same query ran within the last 7 days. The first user each day pays ~$0.01 for the scan. Everyone else that day gets sub-second responses from cache.
Step 3 — Identity & Security (No IAM Users)
One design principle held throughout: no IAM users anywhere. Every action is performed by IAM Roles with temporary STS credentials that auto-expire in 15 minutes.
Browser Opens URL
User navigates to the CloudFront URL. No AWS identity, no login, no VPN required.
React App Calls API
The React app calls fetch() to API Gateway. Still no AWS identity — just an HTTPS request from the browser.
Lambda Assumes IAM Role via STS
API Gateway invokes Lambda. Lambda automatically assumes ebsp1-lambda-role — 15-minute temporary credentials, issued at runtime, never stored anywhere.
Athena Queries CUR Data
Lambda calls Athena with those temp credentials. Athena reads S3. Results written to the results bucket. No human credential ever touched the data.
Full Auditability for Free
CloudTrail records every Athena query attributed to the Lambda role ARN. No credential management overhead, no keys to rotate when someone leaves.

The IAM role policy is scoped to exactly what Phase 1 needs:
Athena:   StartQueryExecution, GetQueryExecution, GetQueryResults
S3 CUR:   GetObject, ListBucket  (read-only)
S3 Res:   PutObject, GetObject, DeleteObject
Glue:     GetTable, GetDatabase, GetPartitions
# No EC2, no STS AssumeRole, no Organizations — CUR data only
Step 4 — Lambda & API Gateway
Lambda (handler_phase1.py) is the engine of the dashboard. It receives the API Gateway request, builds a parameterised Athena SQL query, polls for results, and returns a structured JSON payload to the browser.
Key design decisions in the Lambda:
- Region filter —
?region=us-east-1appended to the fetch URL threads through to a{region_filter}placeholder in the SQLWHEREclause - Months selector — 3/6/12/18 months controls how far back the Athena query looks
- Split-month logic — divides data into pre-cleanup and post-cleanup periods to calculate savings delta
- Division-by-zero guard — returns zero savings (not an error) when there is no pre-cleanup data
API Gateway is configured as an HTTP API (not REST) with CORS open for Phase 1 testing. Before connecting real CUR data at work, add IAM authorization or an API key so the endpoint is not publicly callable.
Step 5 — React Dashboard on CloudFront
The React app (AWS CloudScape Design System) is compiled with npm run build and synced to a private S3 bucket. CloudFront sits in front of it via OAC (Origin Access Control) — the S3 bucket has no public access at all. Every request is served over HTTPS from the free *.cloudfront.net certificate.
Deploying a new version is three commands:
npm run build
aws s3 sync dist/ s3://ebsp1-frontend-684346483786/ --delete --profile personal
aws cloudfront create-invalidation \
  --distribution-id E3W08TQPVK17E8 \
  --paths "/*" --profile personal
The CloudFront URL is permanent — it does not change when you redeploy. Share it once with your FinOps team and it always points to the latest version.
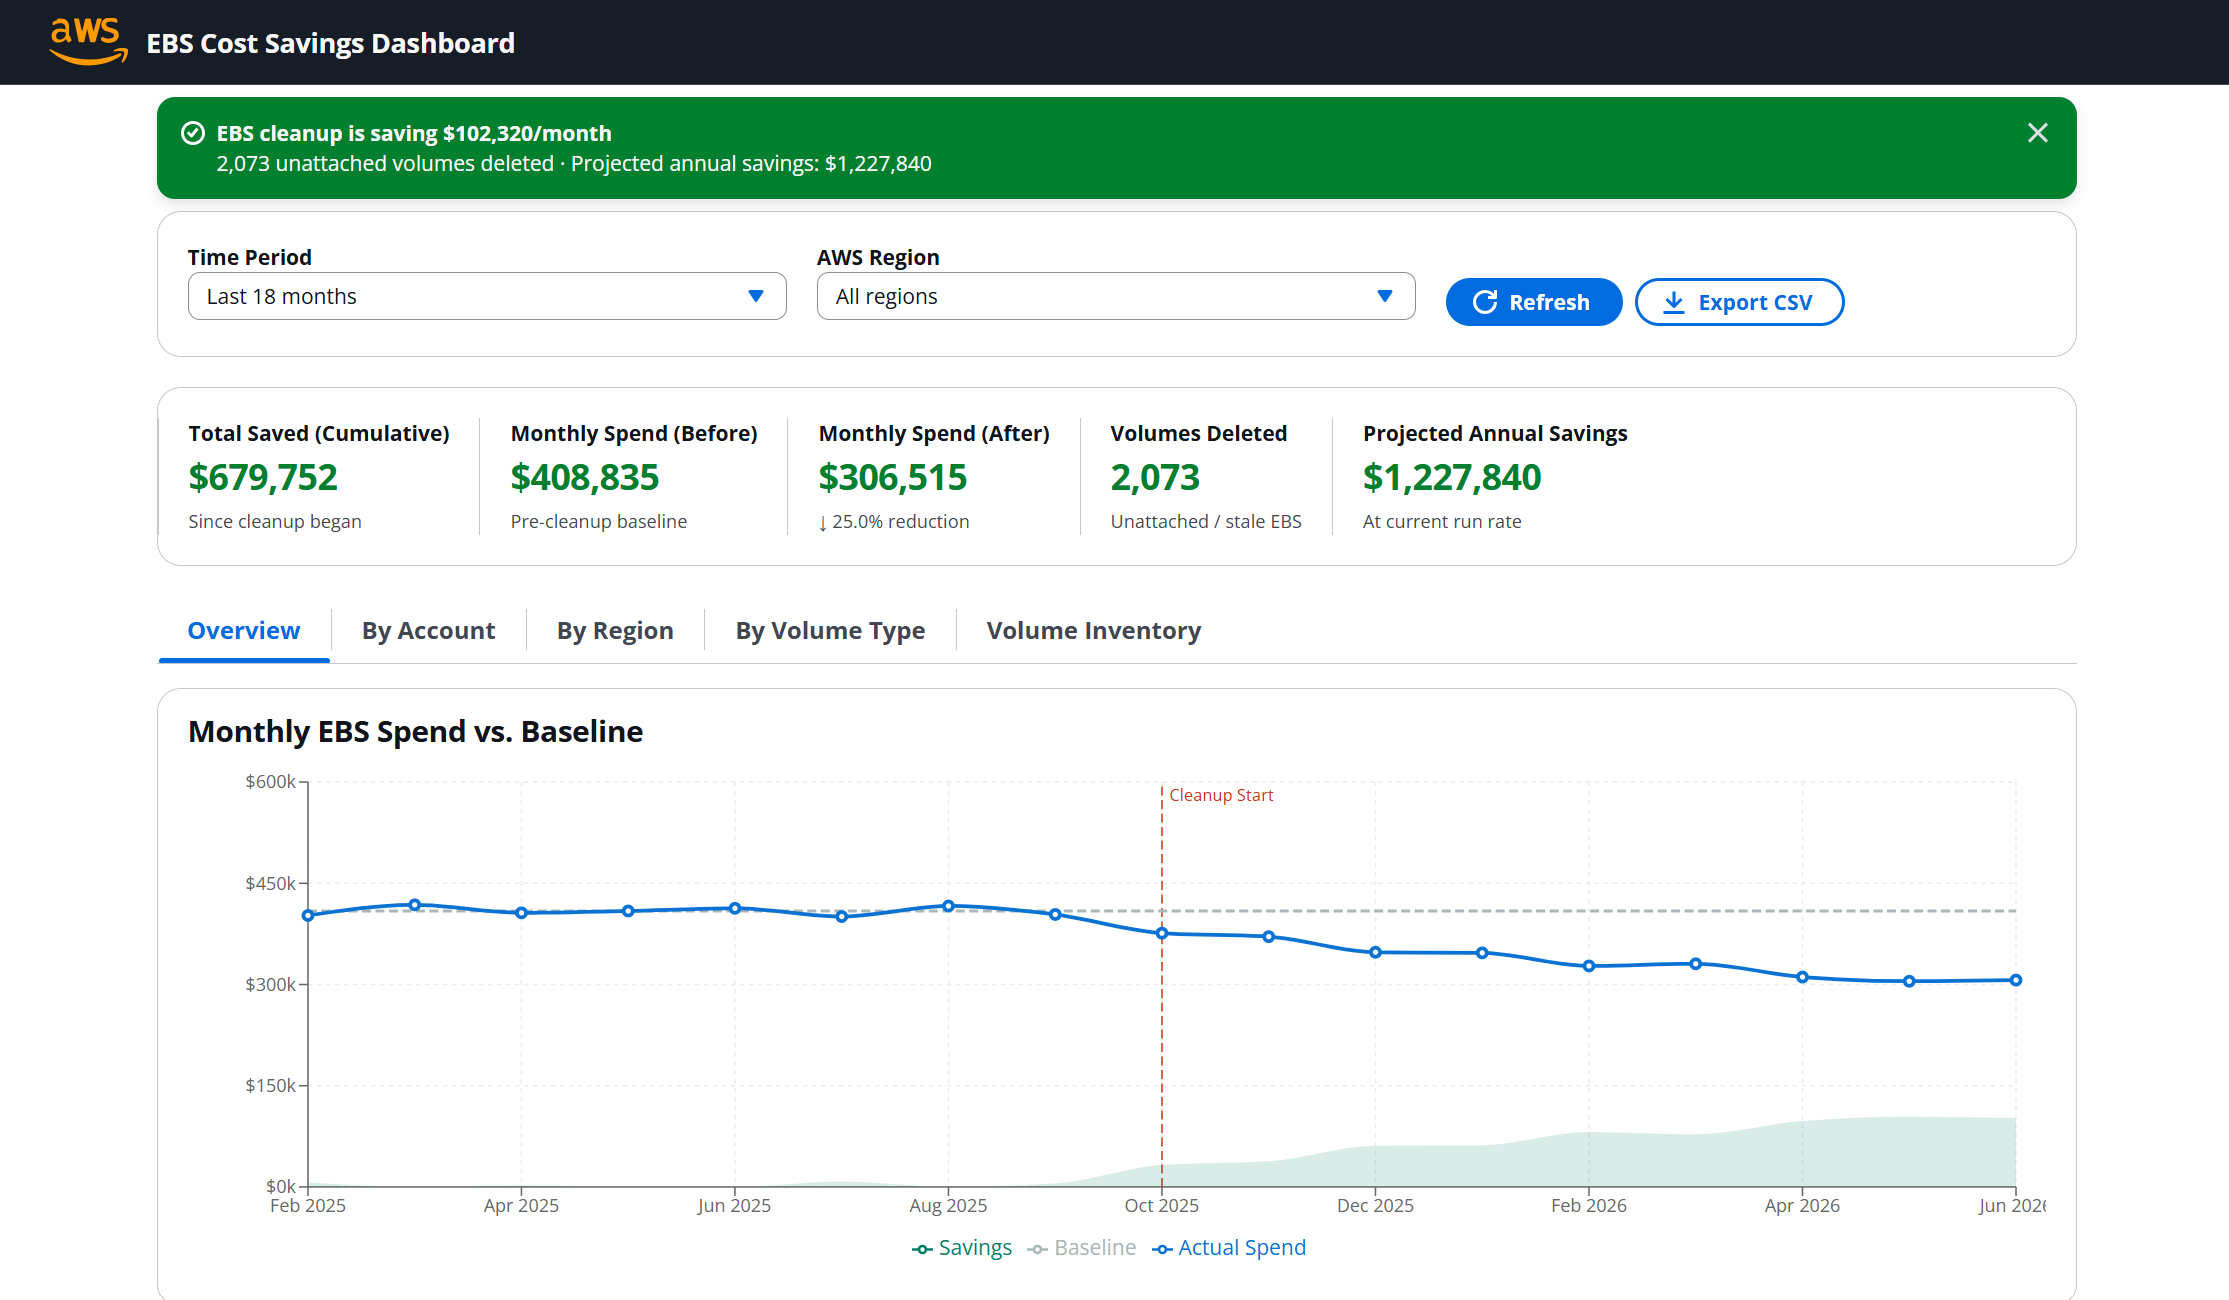
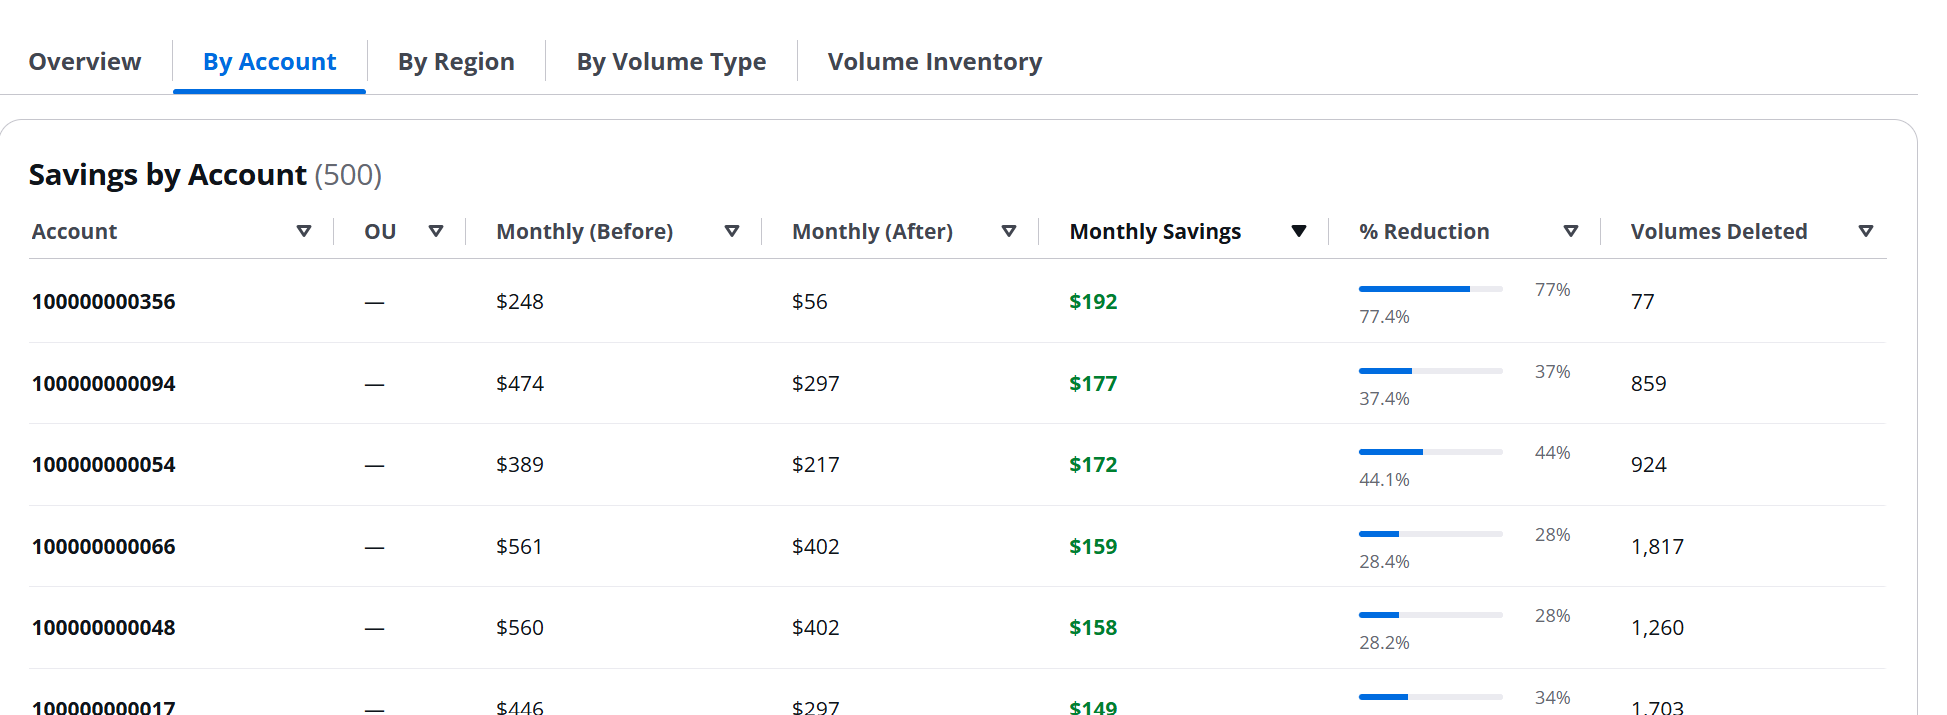
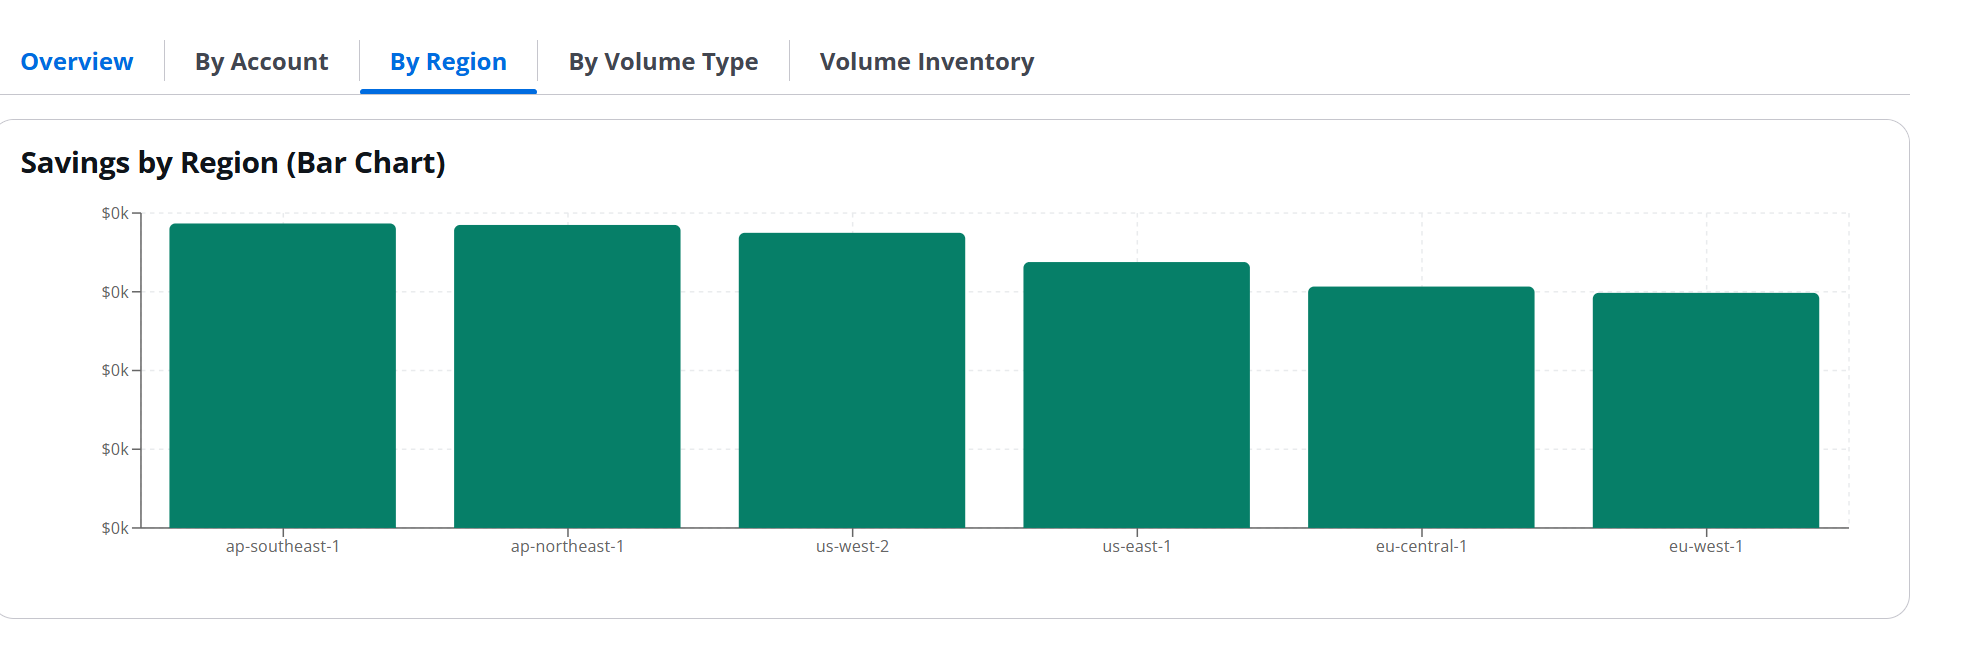
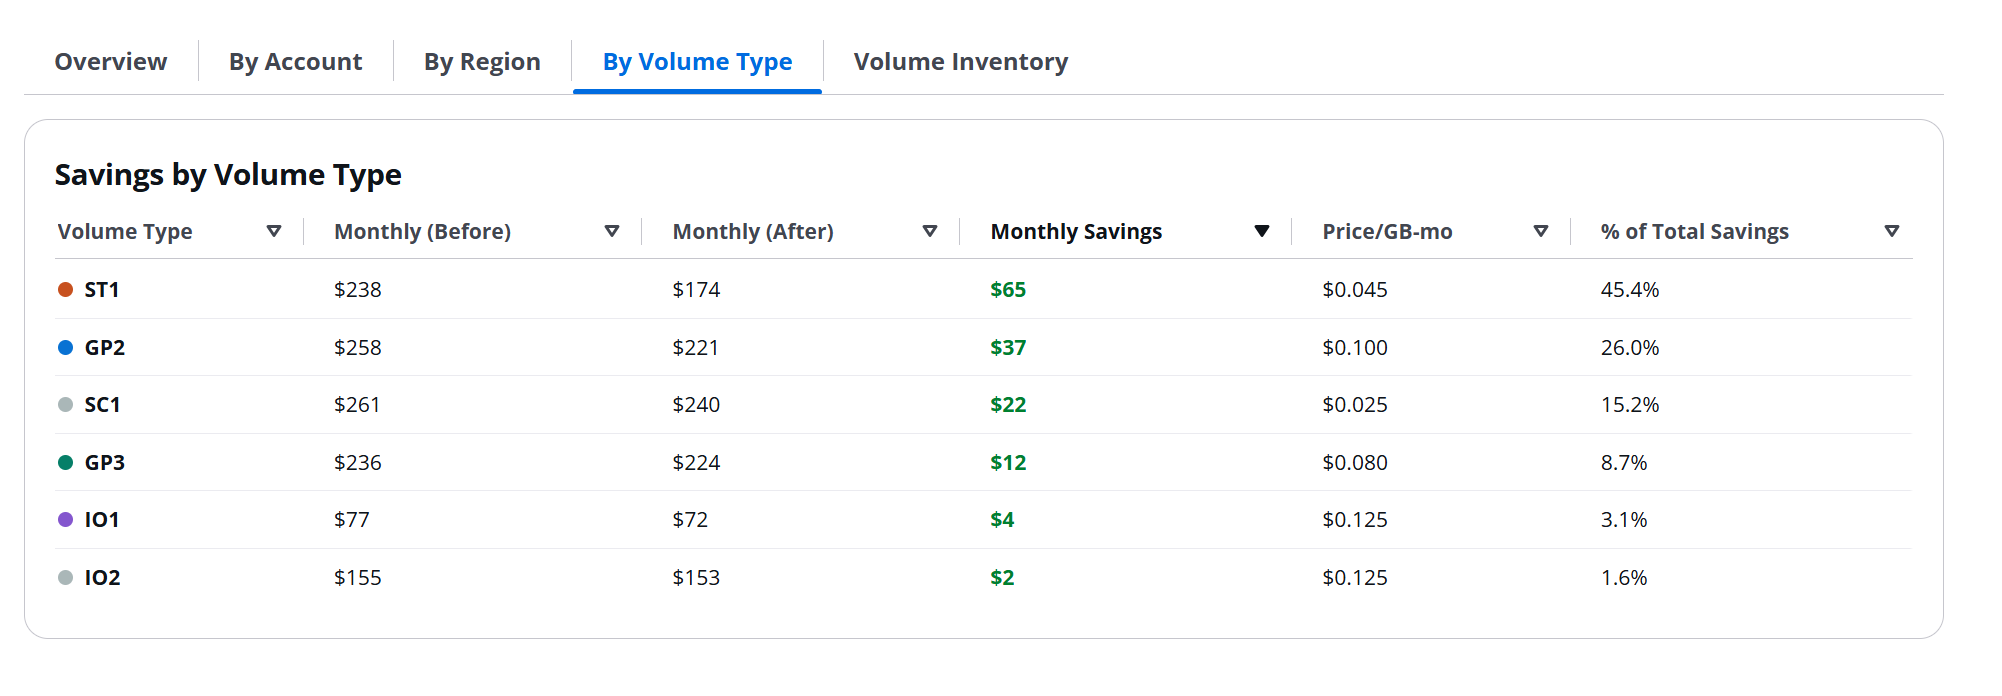
What the Dashboard Shows
The dashboard has four tabs, all responding to a global region filter and months selector (3 / 6 / 12 / 18 months).
Challenges & Real Bugs Fixed
The bug: summing volume_count across all 18 months instead of taking first month count minus last month count. Cross-month summation inflated the number by 18×.
volumes_deleted = first_month_count − last_month_count
When cleanup_start was an empty string, all months landed in the "post" bucket — zero pre-cleanup data, zero calculated savings delta per region.
Added a midpoint fallback: when cleanup_start is empty, use the halfway point of the date range as the split.
Mock data churn rate was 3% per month. Over 18 months this deleted more volumes than plausibly existed, making post-cleanup cost higher than pre-cleanup cost.
✓ FixReduced churn rate to 0.5% — realistic for a managed enterprise environment.
The selected region value was not being appended to the API URL, so Lambda received no region parameter and returned all-region data regardless of selection.
✓ FixAppend ?region={selectedRegion} to the fetch call and thread it to a {region_filter} placeholder in the Lambda SQL.
Cost to Run
| Service | Usage | Monthly Cost |
|---|---|---|
| Lambda | ~30 invocations · 512 MB · 15s avg | $0.00 (free tier) |
| Athena | ~5 queries/day · 400 KB scanned (Parquet) | <$0.01 |
| S3 (3 buckets) | ~8 MB total stored | <$0.01 |
| CloudFront | <1 GB transfer · PriceClass_100 | $0.00 (free tier) |
| API Gateway | <1 million requests | $0.00 (free tier) |
| Glue Crawler | 1 run/month · <1 min | $0.00 (free tier) |
| Total | ~$0–2/month |
At enterprise scale (real CUR, 500 accounts, 50 engineers opening the dashboard daily), Athena cost rises to ~$2–5/month due to larger Parquet files. Everything else stays the same.
CUR updates once per day. The right pattern is: EventBridge daily pre-warm at 06:00 UTC (Lambda warms the Athena cache before anyone opens the dashboard) + Athena Query Result Reuse (7-day cache, $0 for repeat queries) + CloudFront API cache (5-min TTL). First user each day pays ~$0.01. Everyone else gets sub-second responses.
Switching to Real CUR Data (3 Steps)
Phase 1 runs on synthetic data. When your platform team enables real CUR, only three things change. Lambda, API Gateway, CloudFront, and the React dashboard are untouched.
Enable CUR 2.0 Export (Management Account)
Ask your FinOps or Platform team: Billing → Data Exports → Create export with the selections above. This requires management account access — not a member account.
Update Two Lambda Env Vars
In Terraform: ATHENA_DATABASE → the Glue database AWS auto-creates (athenacurcfn) and CUR_TABLE → your export report name. Run terraform apply.
Update SQL Column Names
Swap synthetic names for real CUR column names in handler_phase1.py: line_item_usage_account_id, line_item_unblended_cost, product_regioncode, etc. These are identical across every AWS org worldwide.
What Phase 2 Adds
Phase 1 answers "how much are we spending." Phase 2 will answer "which specific volumes should we delete today."
Phase 2 adds cross-account EC2 inventory via STS AssumeRole. Lambda will temporarily assume an EBSDashboardReadRole in each member account and call EC2:DescribeVolumes to pull live attachment status, volume state, last-attached time, and tags.
A CloudFormation StackSet (deployed via Terraform) automatically creates EBSDashboardReadRole in every member account — including new accounts added to the org in future. The trust policy uses a PrincipalOrgID condition so only Lambda inside the same AWS Organization can assume the role. No IAM users, no long-lived credentials — same security model as Phase 1.
This unlocks a fifth tab: Volume Inventory — a sortable table of every unattached volume with size, type, region, account, last-attached date, and projected monthly saving if deleted.
Key Takeaways
Column names are standardised by AWS and identical across every company, every account, every region. The SQL you write against synthetic data works against your employer's real CUR without modification — only the S3 path and table name change.
Lambda runs as an IAM Role with temporary STS credentials. No keys to rotate, no credentials to leak, no access to revoke when someone leaves the team. CloudTrail gives full auditability for free.
Building and debugging the entire pipeline against mock data meant no risk of accidentally querying real billing data, no waiting 24 hours for CUR delivery, and full control over the data shape. Every tab, filter, and edge case was proven before connecting real data.
What’s Next
- Add API Gateway authorization (IAM auth or API key) — current endpoint is open for testing only
- Add CloudWatch alarms for Lambda error rate and p99 duration
- Add EventBridge daily pre-warm schedule (06:00 UTC)
- Connect real CUR 2.0 export from management account
- Phase 2: StackSet deployment + live Volume Inventory tab
Full Terraform, Lambda handler, React dashboard, and architecture draw.io diagrams are in the GitHub repo.
Comments