📋 In This Post
Why — The Problem This Solves
A Log Analytics workspace costs nothing to own. It costs money the moment something sends it data, and by then the decisions that set the price — which table, which plan, what gets filtered — have already been made for you by defaults.
This week builds the workspace every later week in the lab reports into, and makes those three decisions on purpose.
What You Need to Know — Skills & Tools
- Table plans — Analytics, Basic and Auxiliary, and that they differ in how you are charged to query, not just to ingest.
- Data collection rules, and that a DCR can transform data before it is stored.
- KQL, enough to write one
whereclause. - The daily cap, and why it is not a cost strategy.
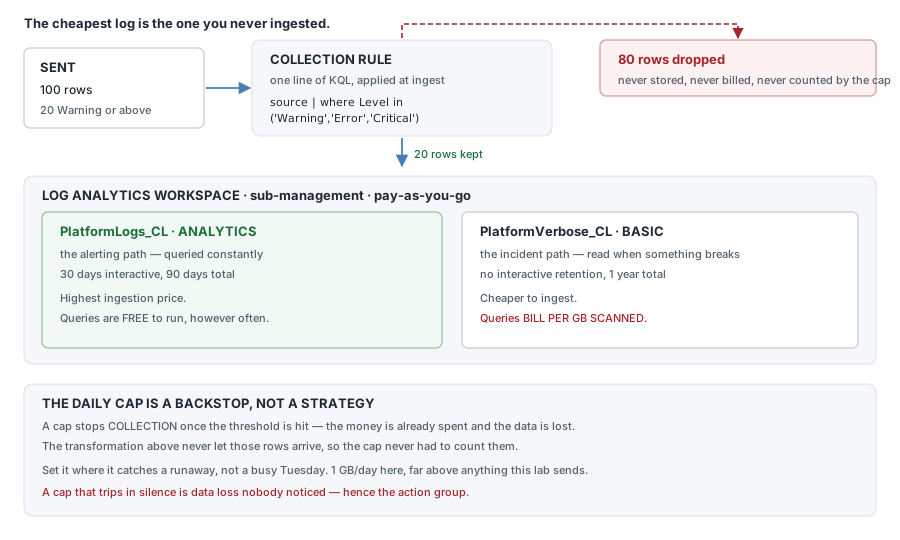
Architecture — How It Fits Together
How We Built It — In Deployment Order
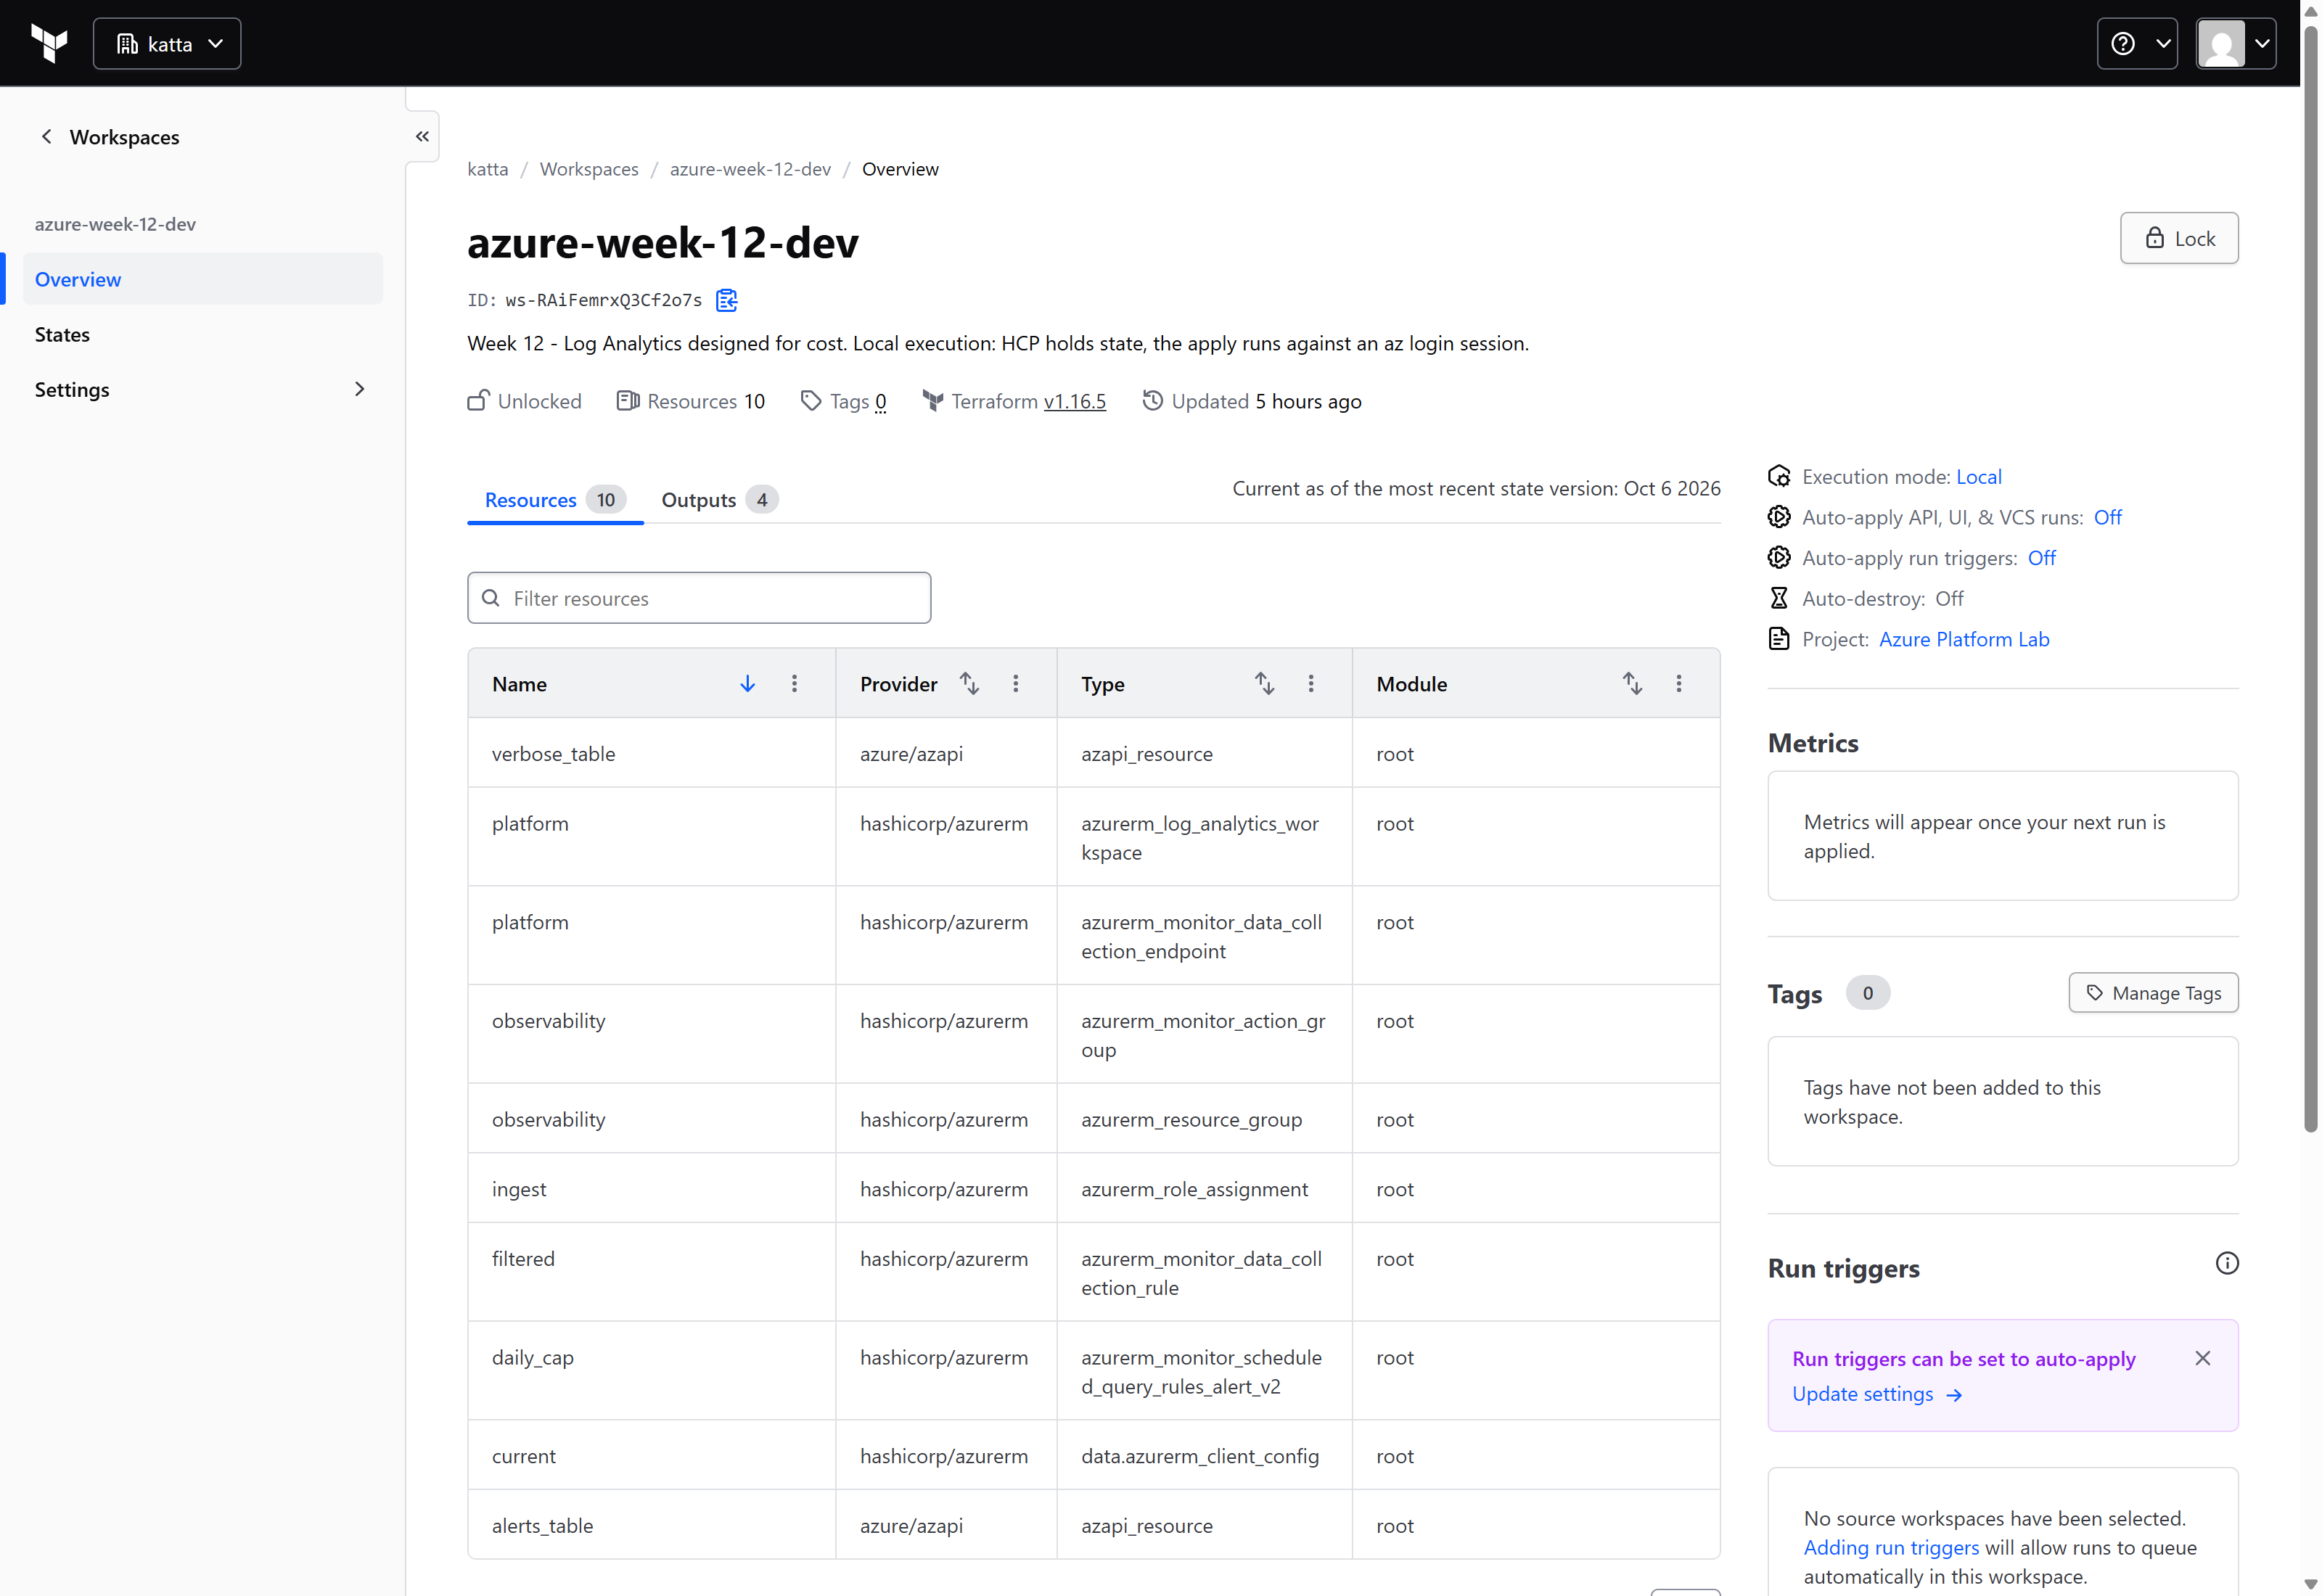
1. The HCP workspace, created first and deliberately
This is a step, not a side effect. Creating it explicitly means setting its execution mode at birth:
POST /api/v2/organizations/Katta/workspaces
{ "name": "azure-week-12-dev", "execution-mode": "local" }

created: azure-week-12-dev | execution-mode: local
Week 7 let terraform init create the workspace instead, and HCP
defaulted it to remote execution. The plan then ran on HCP's
servers, where there is no Azure CLI and no credentials, and failed with
az: executable file not found in $PATH — an error that sends you
debugging the wrong machine entirely.
And this is the workspace it created — 10 resources, 4 outputs, and Execution mode: Local, which is the setting the whole step exists to get right:
2. The Terraform
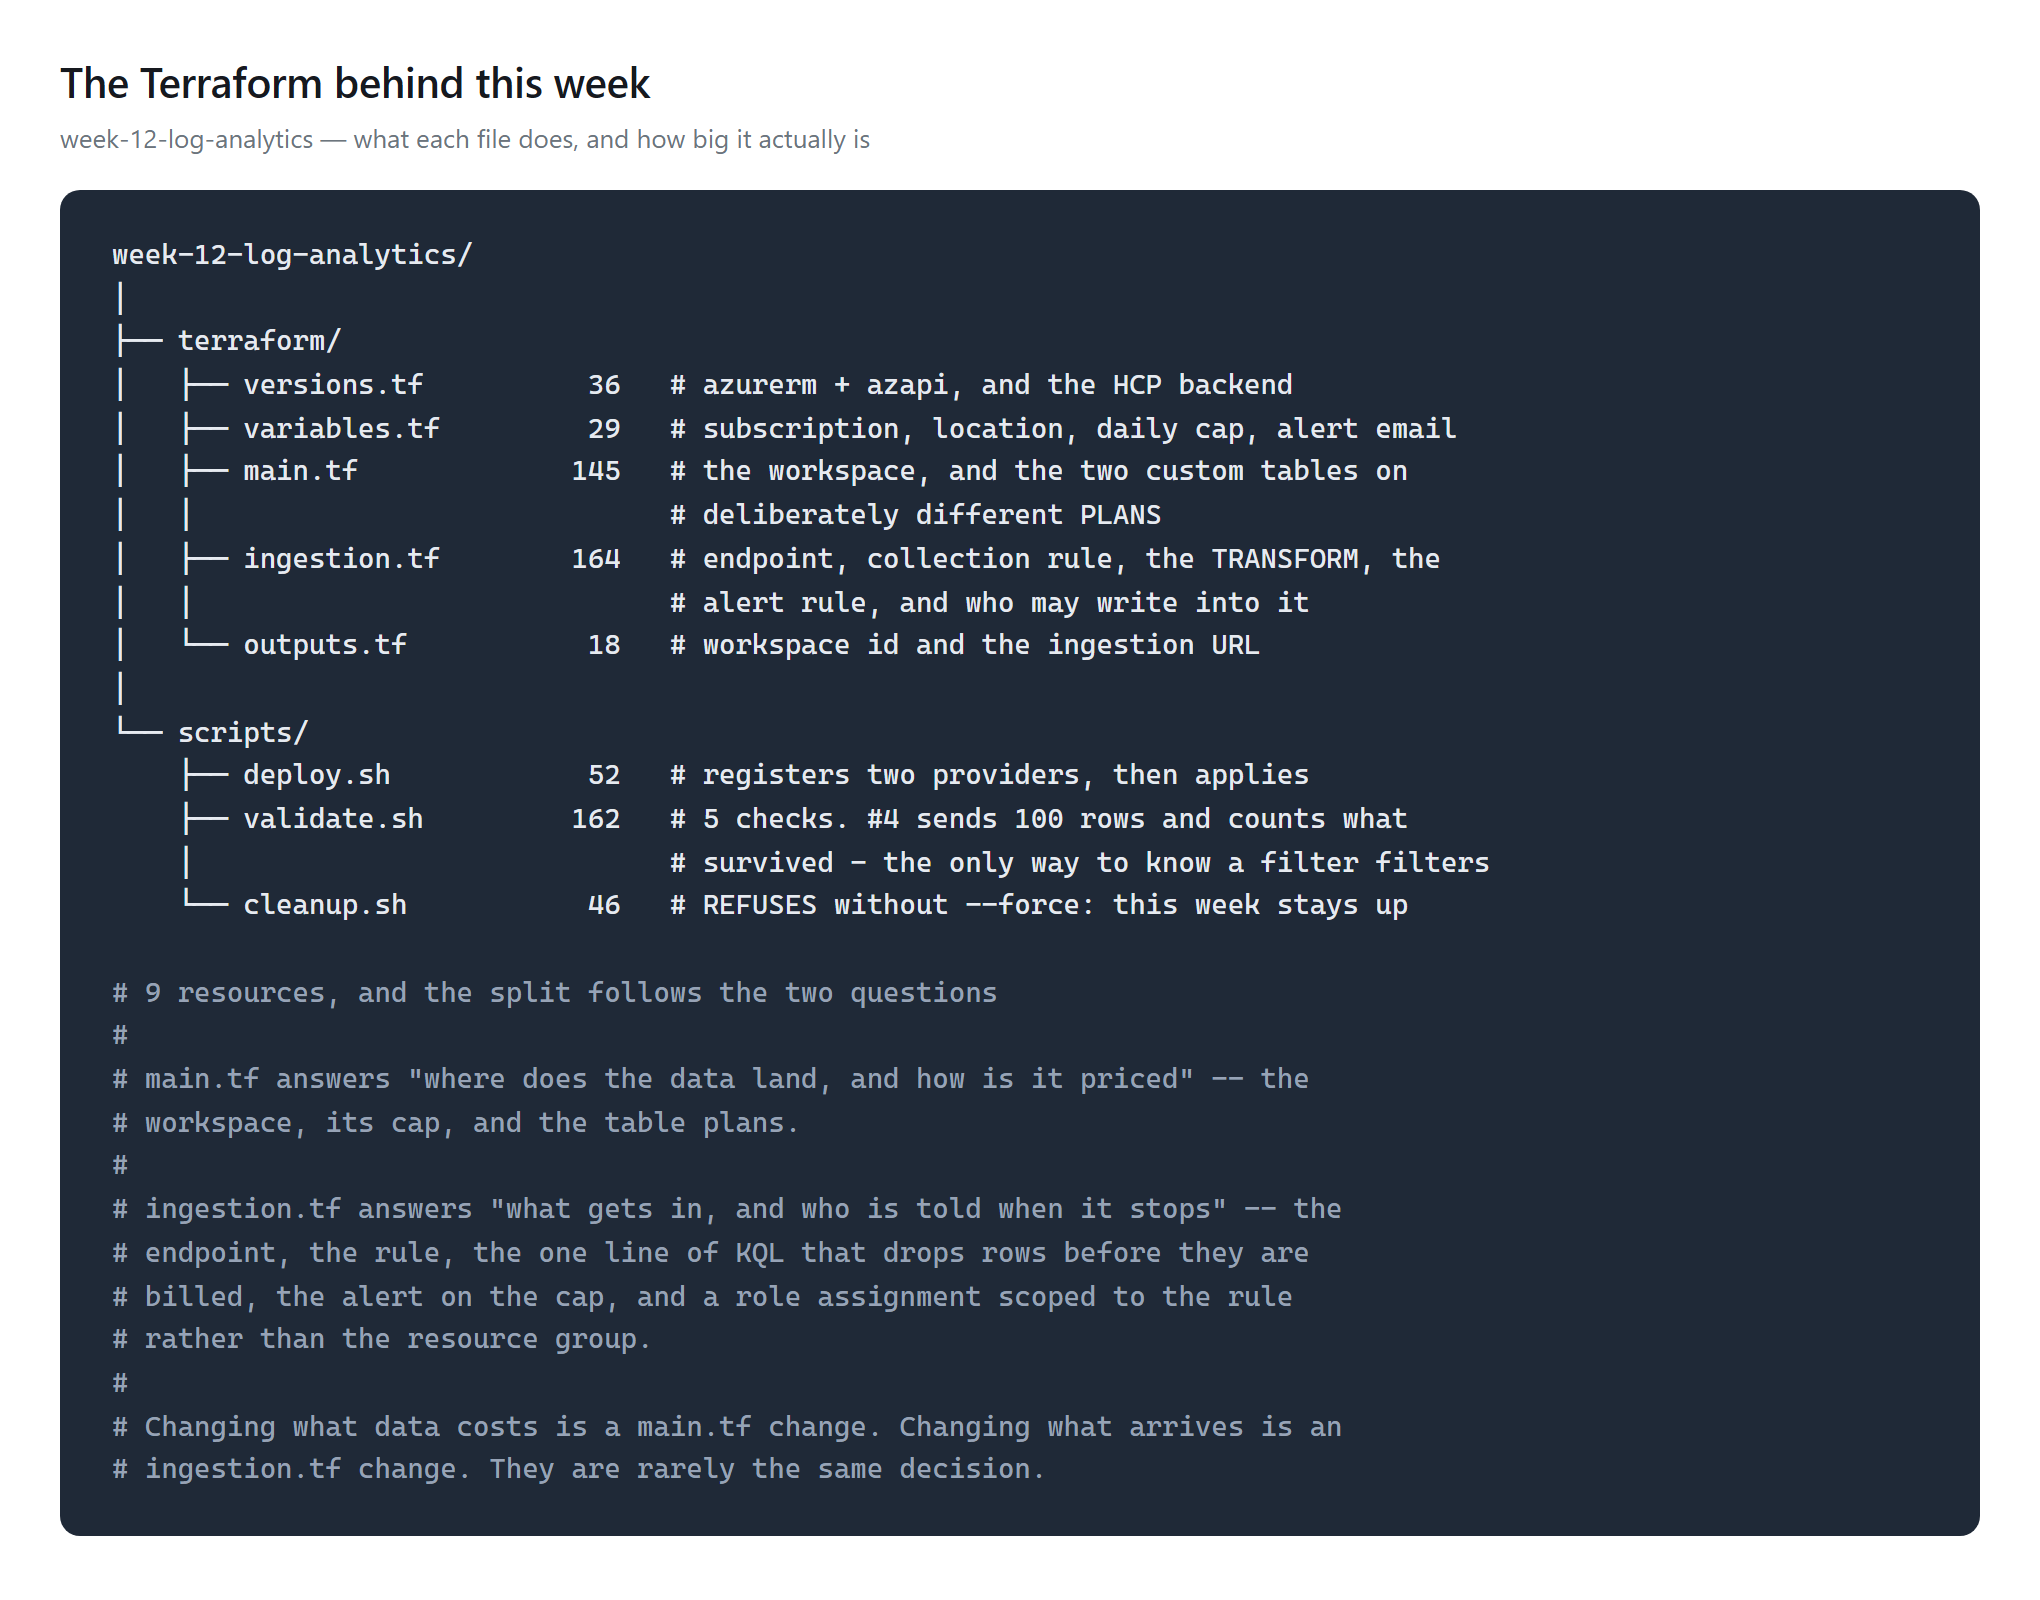
main.tf answers "where does the data land, and how is it priced".
ingestion.tf answers "what gets in". Changing what data costs and
changing what arrives are rarely the same decision, so they are rarely the same
file.Decision one: table plans follow how data is used, not how big it is. These are the prices Azure quotes for this workspace:
| Plan | Per GB ingested | Queries | Interactive window |
|---|---|---|---|
| Analytics | $2.76 | free to run | up to 2 years |
| Basic | $0.60 | bill per GB scanned | fixed 30 days |
| Auxiliary / Lake | $0.06 | bill per GB scanned | full retention |
A 46× spread — and queries are where it gets interesting. Analytics costs the most to ingest and nothing to query. Basic and Auxiliary are cheap to ingest and bill per GB scanned. So a cheap table queried often can cost more than an expensive one queried rarely.
resource "azapi_resource" "alerts_table" {      # the alerting path
  name = "PlatformLogs_CL"
  body = { properties = { plan = "Analytics",   # queried constantly
                          retentionInDays = 30,
                          totalRetentionInDays = 90, ... } }
}

resource "azapi_resource" "verbose_table" {     # the incident path
  name = "PlatformVerbose_CL"
  body = { properties = { plan = "Basic",       # read when something breaks
                          totalRetentionInDays = 365, ... } }
}
Decision two: the daily cap is a backstop, not a strategy. Microsoft's own guidance says it "should not be used as a primary mechanism to filter or reduce data" — when a cap trips, collection stops. The money is already spent and now you have lost the logs as well. It is set at 1 GB/day, far above anything this lab sends: a cap set near normal volume trips on a normal busy day.
Decision three: the transformation is the actual control. One line of KQL, applied at ingest:
transform_kql = "source | where Level in ('Warning','Error','Critical')"Anything below Warning is never written, so it is never billed — and the cap never has to count it.
Rows below Warning are never written, never stored and never billed. The cap never has to count them, because as far as the bill is concerned they never arrived.
3. Deploying it
./scripts/deploy.sh      # registers two providers, then applies
./scripts/validate.sh    # 5 checks; #4 sends 100 rows and counts survivors
./scripts/cleanup.sh     # refuses - this week stays up. --force to mean it
4. What appeared in the portal
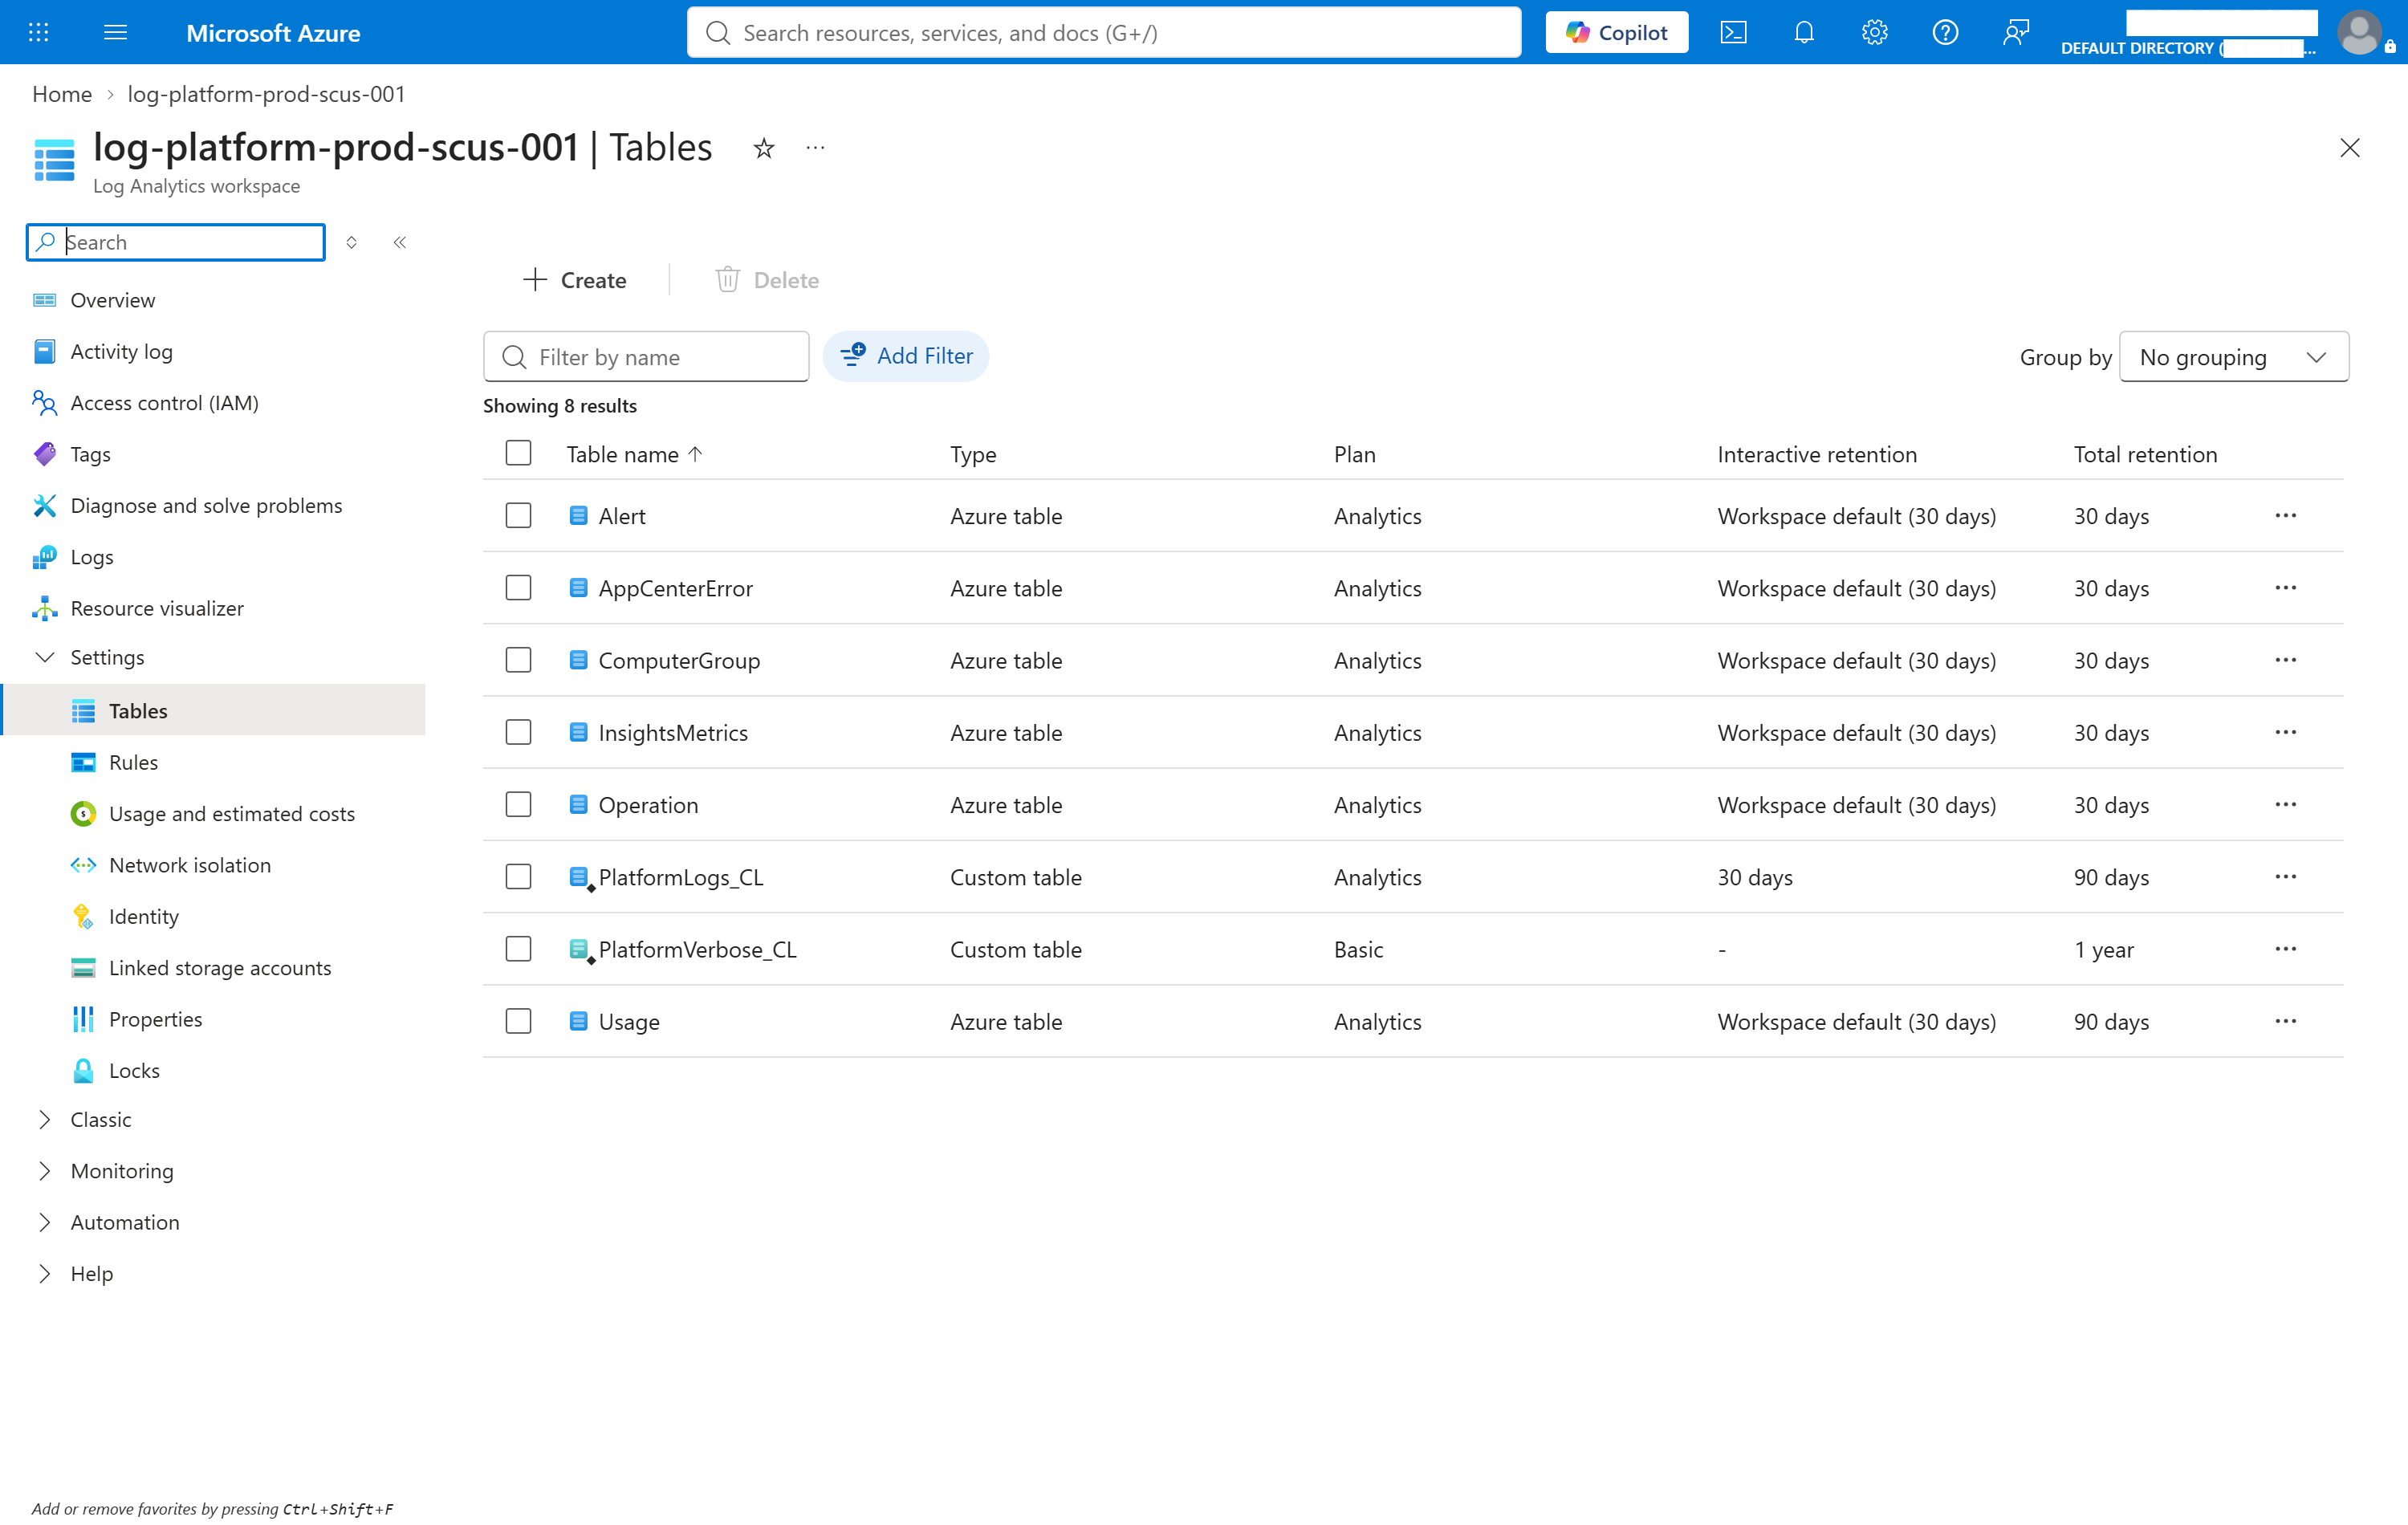
This is the design in one screen. Two custom tables on deliberately different
plans — and note PlatformVerbose_CL shows no interactive
retention at all, because Basic fixes the query window at 30 days. Every
built-in table sits on the Analytics default beside them, which is what you get
if you never make the decision.
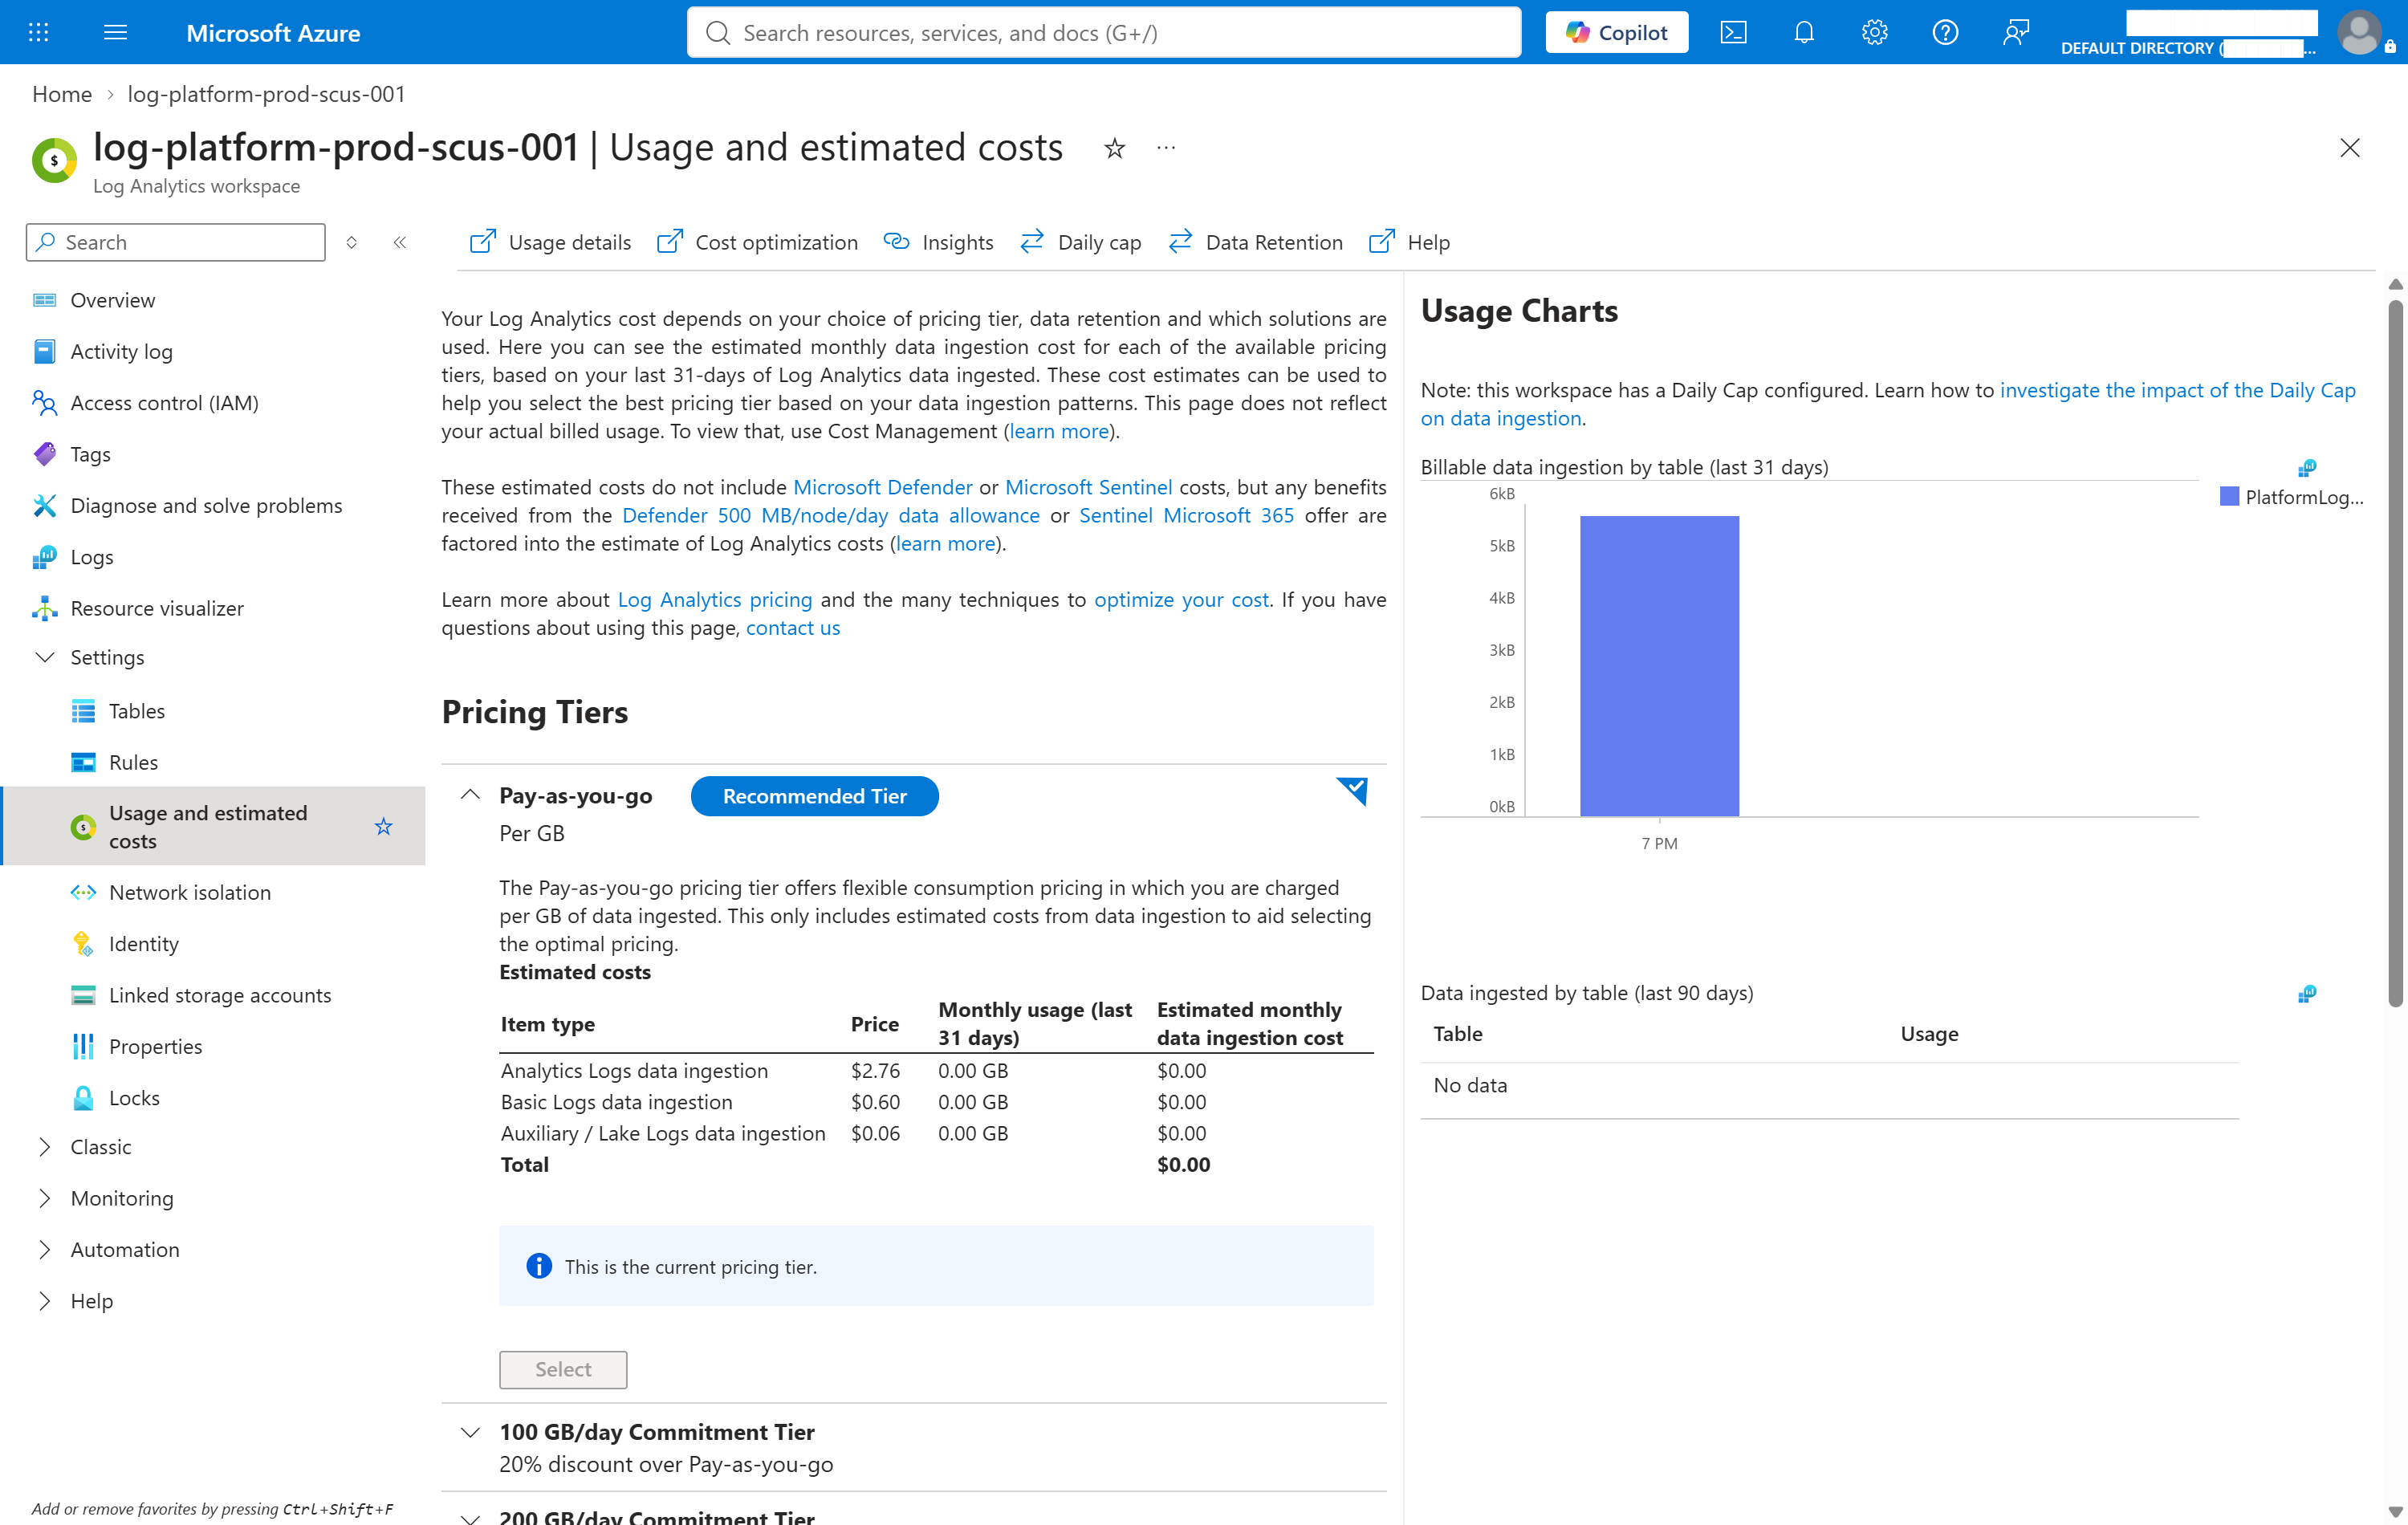
Azure's own numbers, and a note confirming the cap is configured. The commitment tier below is worth reading too: 100 GB/day for 20% off. A lab never reaches that, so pay-as-you-go is the honest choice here and the discount is not claimed.
How It's Tested
A transformation that filters nothing looks identical in the portal to one that filters everything. The only way to know is to send known data and count what survived:
4. The transformation drops rows BEFORE they are billed
   sending 100 rows, 20 of them Warning or above
   ingestion API returned HTTP 204
   rows stored: 20 of 100 sent
   RESULT: 20 stored, 80 dropped at ingest and never billed

── 5 passed, 0 failed ──
The two levers compound. Drop 80% at ingest, then put what survives on the right plan, and the difference is between paying $2.76 a GB for everything and paying it for the fifth you actually query.
Challenges — What Actually Went Wrong
You cannot set a plan on a table that does not exist. The
first attempt put AzureDiagnostics on Basic and got
ResourceNotFound: a new workspace has no built-in tables, because
they materialise when data of that type first arrives — after the point you
would want the cheap plan in place. The collection rule then failed with a bare
InvalidPayload for the same reason. Hence custom tables, created
with azapi, because
azurerm_log_analytics_workspace_table has nowhere to put a schema.
Ingestion returns 403 until RBAC propagates. Posting needs
Monitoring Metrics Publisher on the DCR, and granting it is
not instant. Measured: ten attempts over five minutes, then 204.
The cap had no alarm, and the check said it did. An action group is a destination; nothing fires it without a rule. The test counted action groups and passed while the cap could still trip in silence. A mailbox is not a smoke detector, and a check that goes green while the thing it verifies is missing is worse than no check.
Security — Controls at Every Layer
- Resource-only permissions. Reading one resource's logs needs no grant on the workspace. Workspace Reader hands over every log from every subscription at once.
- Shared keys off. The workspace ID and key pair is a password that never expires and records nothing about who used it. Callers use Entra tokens.
- Publisher scoped to the DCR, not the resource group. Getting that role wrong means someone forging logs.
- The cap has an alarm, because one that trips in silence is data loss nobody noticed.
Cost
The workspace costs nothing to own — you pay for ingestion and for retention beyond the included 30 days. This week ingested under 1 MB, so the measured cost is $0.00.
That is the honest number, and it is also the point: at lab volume none of this matters. The design matters at production volume, which is why the week measures the ratio — 80% dropped, a 46× spread between plans — rather than a dollar figure that would be meaningless at this scale.
Cleanup
This week stays up. Weeks 13 to 16 send their data here and an
idle workspace costs nothing, so cleanup.sh refuses without
--force.
When it does run, the workspace is soft-deleted for 14 days and its name stays reserved — so rebuilding inside that window fails on a name conflict unless you recover it rather than create a new one.
References
- Configure a table plan in a Log Analytics workspace
- Azure Monitor Logs cost calculations and options
- Set a daily cap on a Log Analytics workspace
- Well-Architected: Log Analytics
- Week 12 code in the lab repository
Key Takeaways
- Filter at ingest, not with a cap. A cap stops collection after the money is spent; a transformation means the rows never arrive.
- Pick the plan by how the data is queried. Analytics is free to query; Basic and Auxiliary bill per GB scanned. Cheap to ingest and cheap to use are different properties.
- Set the table plan before data arrives — if you can. Built-in tables do not exist until their first row does.
- An action group is not an alarm. Without a rule firing it, nothing happens and nobody is told.
Comments