📋 In This Post
Why — The Problem This Solves
Someone turns on flow logs account-wide during a compliance push. The logs land in a bucket. Nobody has permission to read that bucket, and nobody has built a table over it, so nothing is ever queried.
Months later a NAT bill quadruples, or a host starts talking to somewhere it should not. The answer is technically sitting in S3. Getting it out means writing a Glue table definition, working out a partition strategy, and hand-writing SQL against a 30-field record format — under incident pressure, by someone who has not done it before.
The specific gap: flow logs are pure cost until someone builds the query layer, and the query layer is the part that always gets deferred. You pay $0.25 per GB ingested whether or not a single query ever runs.
Why teams do not already have this
- The failure is silent. No alarm fires for "your logs are unqueryable". There is no red status anywhere. You find out mid-incident.
- It is unglamorous. A table definition, a partition template, and a handful of saved queries. No console button produces it, and it is nobody's sprint goal until it is urgently everybody's problem.
- The default destination costs double. CloudWatch Logs feels like the natural choice and is $0.50/GB against S3's $0.25/GB — and it cannot store Parquet at all.
Is this not just GuardDuty?
Worth settling early, because GuardDuty consumes these exact same flow logs and Week 11 already has it running in this account.
GuardDuty matches flow logs against known-bad IPs and behavioural patterns, and tells you when something matches. It does not give you a queryable table, and it cannot tell you which team's traffic drove your NAT gateway bill. Those are the two things this week is for — complementary, not overlapping.
What You Need to Know — Skills & Tools
Nothing here is exotic, but a few concepts decide whether this build works or quietly does nothing at all.
Flow log record versions
The record format is versioned and has moved well past what most tutorials show. v3 added pkt-srcaddr, v5 added traffic-path, v8 added reject-reason, and v11 added interface types, the next-hop family, and embedded EC2 tag values.
Vended log pricing
Flow logs bill as "vended logs": $0.25/GB to S3, $0.50/GB to CloudWatch Logs. The destination is a one-field decision with a 2× cost consequence.
Parquet and columnar scanning
Athena bills on data scanned, not stored. Columnar Parquet means a query reads only the columns it names, so the storage format is the cost model rather than an optimisation.
Partition projection
An alternative to a Glue crawler: rather than discovering partitions on a schedule, you state the pattern and Athena computes them at query time. No DPU charge, no lag — but it fails silently if the template is wrong.
Service-linked roles
Some AWS features create their own IAM role on first use. The v11 tag fields are one: they are served by AWSServiceRoleForVPCFlowLogs, not by any role you write yourself.
Anomaly detection vs static alarms
CloudWatch can learn a band around a metric and alert on deviation, or compare against a fixed number. Knowing which question each answers is what keeps an alarm set both useful and cheap.
Tools used: Terraform via HCP Terraform (VCS-driven), Python 3.12 on Lambda, Athena SQL, and the AWS CLI for verification.
Architecture — How It Fits Together
A small VPC built specifically to produce identifiable traffic, capture into Parquet on S3, and a query layer with a hard spend ceiling on top.
Every resource in the top band exists to produce one specific, recognisable shape of traffic. That is deliberate — it is the data source for the whole build, not scaffolding around it:
- The generator in the private subnet reaches the internet through the NAT gateway, and reaches S3 through a gateway endpoint. Same instance, two destinations, two very different prices.
- The exposed instance in the public subnet has a security group with no ingress rules at all. It is internet-reachable and nothing can connect to it. Those denials are what produce the REJECT records this week analyses — removing them would not harden anything, it would delete the signal.
The one configuration field that halves the bill
CloudWatch Logs
$0.50/GB ingested, plus $0.03/GB-month storage. Plain text only. The right choice if you need metric filters and sub-minute alerting on individual flows.
Amazon S3
$0.25/GB ingested, plus $0.023/GB-month storage. Supports Parquet, which is what makes querying affordable.
For an organisation producing 500 GB of flow logs a month, that is $250 against $125 — $1,500 a year from changing one field.
Why the field list is generated rather than typed
instance_tag embeds the value of an EC2 tag directly into every flow record, turning "who owns this traffic" from a join against an already-stale inventory into a plain GROUP BY.
Parquet columns are matched to the Glue schema positionally. If the flow log's format string and the table's column list disagree on order, every query still runs, still succeeds, and returns values under the wrong column names — bytes reported as packets, source port under destination port. Nothing errors.
So the field list is declared once in Terraform and generates both the log_format string and the Glue columns, which makes that class of bug unrepresentable rather than merely unlikely.
flow_log_fields = [
  { field = "version",      column = "version",      type = "int" },
  { field = "srcaddr",      column = "srcaddr",      type = "string" },
  # ... 30 more ...
  { field = "instance-tag", column = "instance_tag", type = "string" },
]

log_format   = join(" ", [for f in local.flow_log_fields : "$${${f.field}}"])
glue_columns = [for f in local.flow_log_fields : { name = f.column, type = f.type }]
How We Built It — Step by Step
Step 1 — Deploy via HCP Terraform
Fifty-eight resources across four modules, VCS-driven, the same pattern as every week since Week 5.
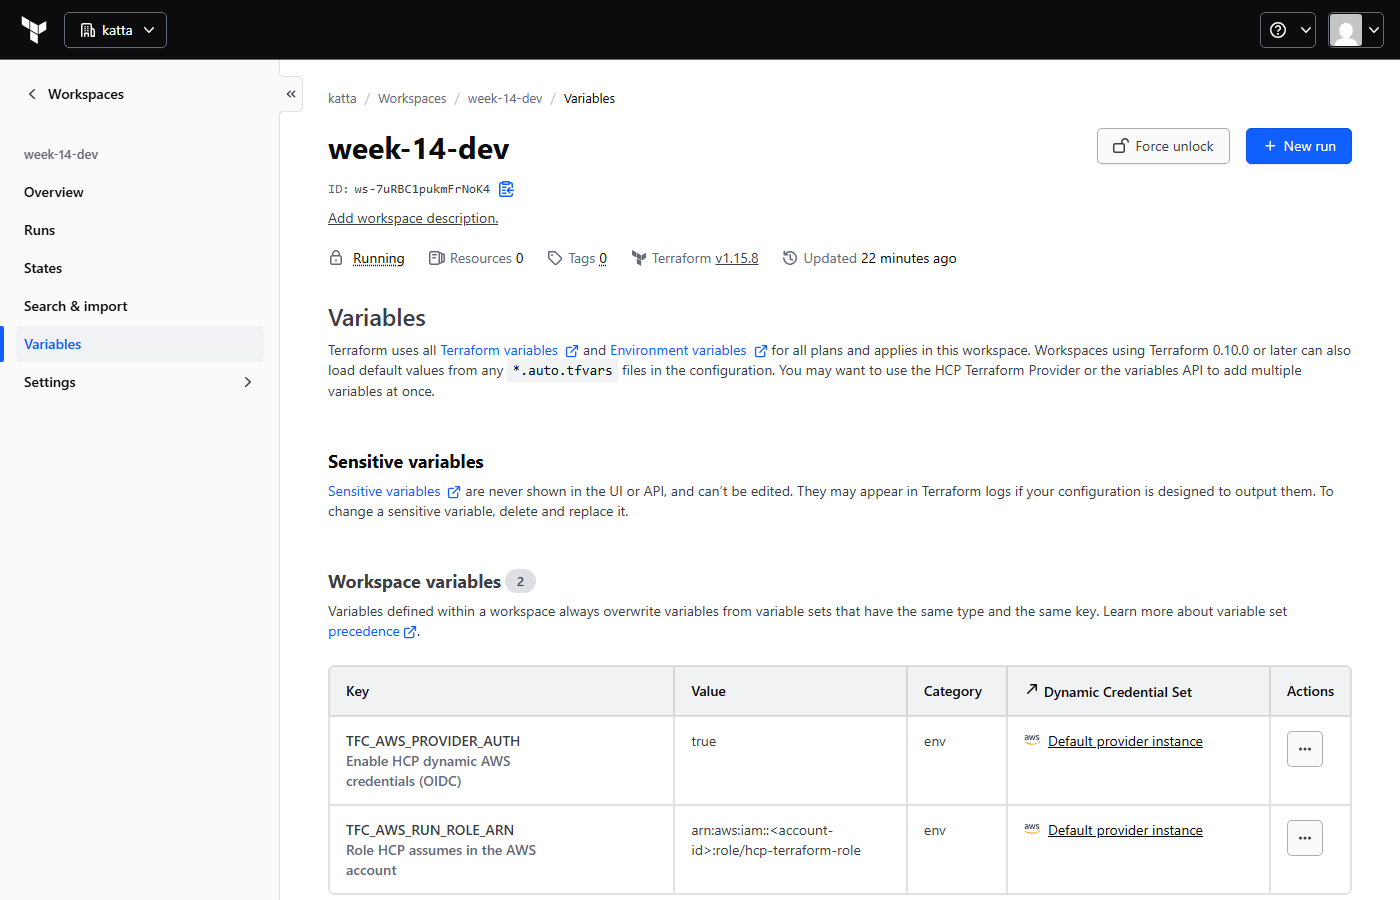
TFC_AWS_PROVIDER_AUTH and TFC_AWS_RUN_ROLE_ARN. Without them the first plan fails with “No valid credential sources found”.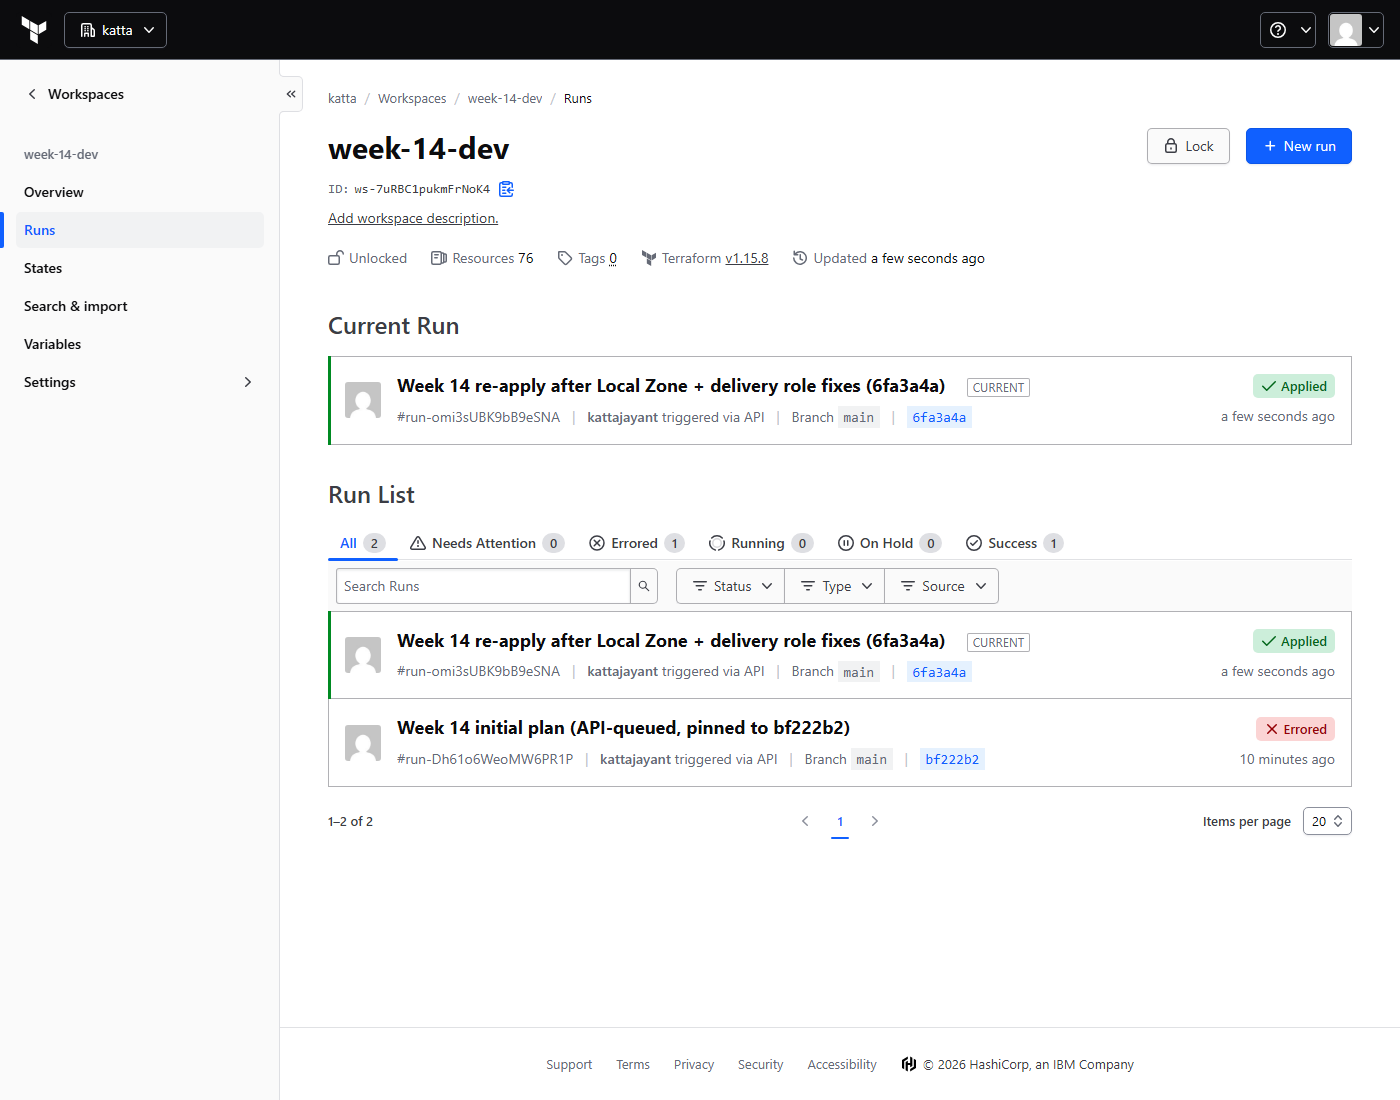
Step 2 — Capture into Parquet, partitioned by hour
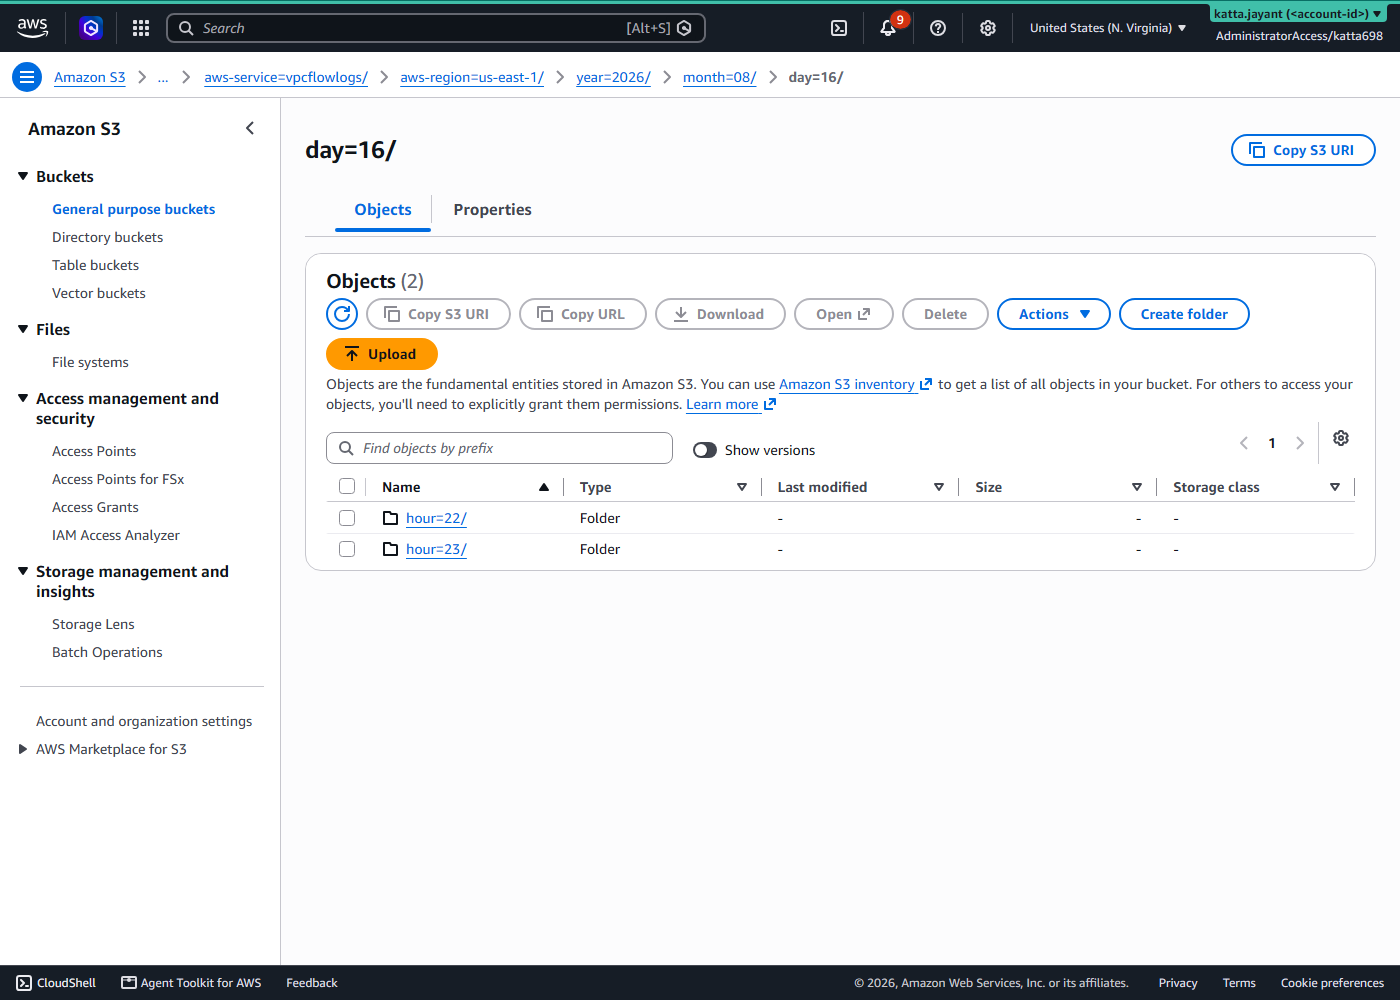
Delivery takes about ten minutes and is written in five-minute batches, so an empty bucket immediately after apply is expected rather than broken.
Step 3 — Define the table without a crawler
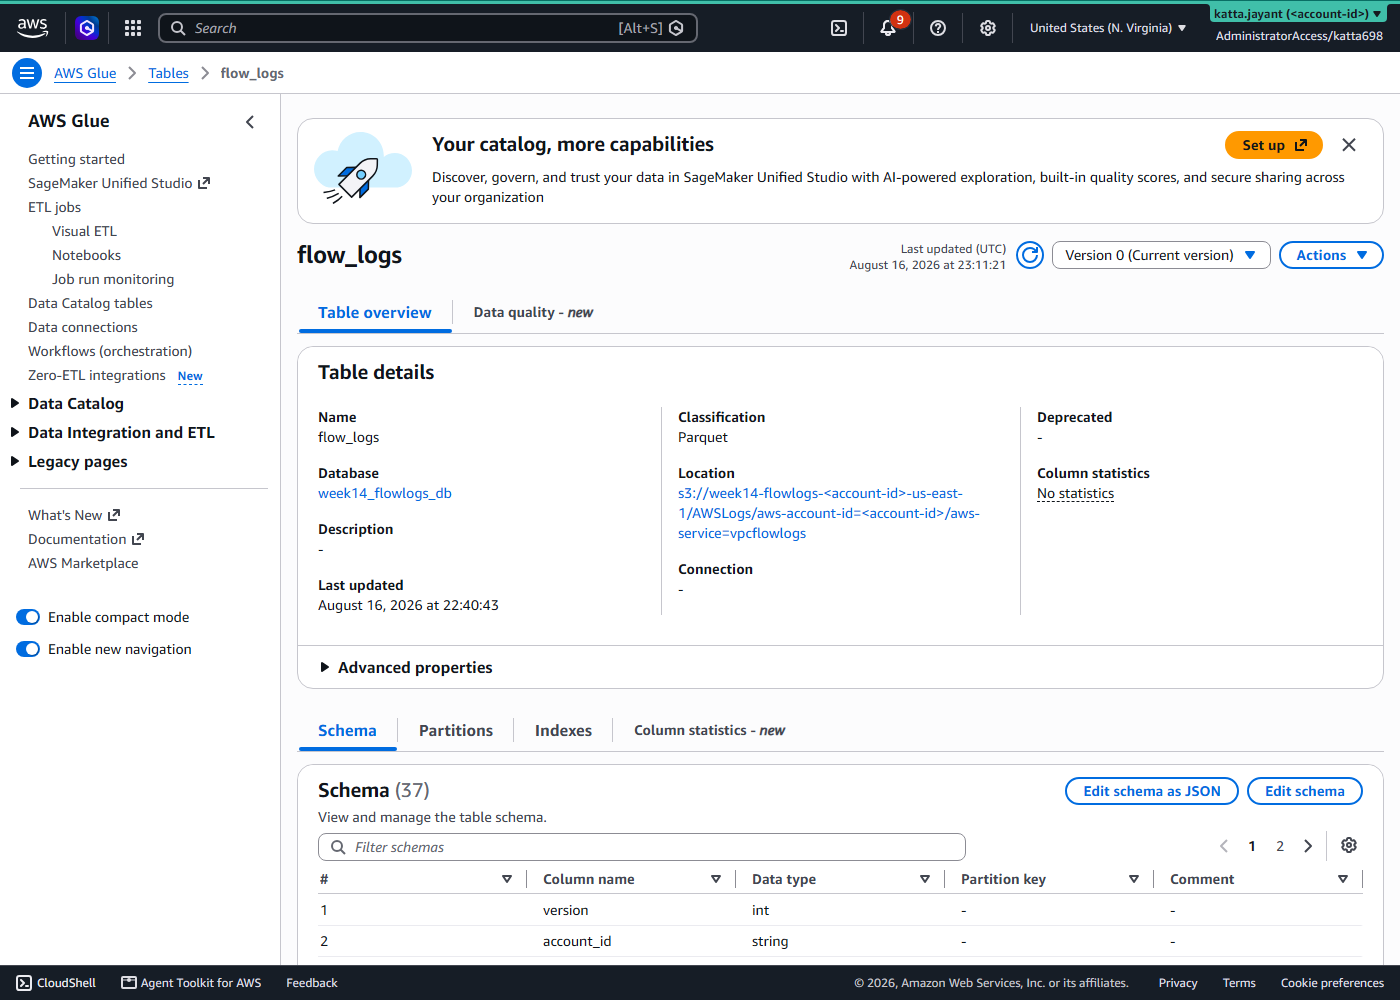
Flow log prefixes are perfectly deterministic — region, year, month, day, hour, all knowable in advance. A crawler would pay DPU-time on a schedule to rediscover a structure we can simply state, and would lag behind new partitions until its next run. Partition projection computes them at query time instead: no schedule, no DPU charge, no lag.
Verifying it actually works
This is the step most worth doing properly, because every failure mode in this build is silent. "It deployed" and "it works" are completely different claims here:
- A projection template that does not match the delivered prefixes returns zero rows and reports
SUCCEEDED. A dashboard on top shows a flat, healthy-looking zero line indefinitely. - Missing tag permissions produce a column of
-rather than an error. - A field-order mismatch returns plausible numbers under the wrong column names.
None of these raise anything, and none are findable by re-reading the Terraform. So the build ships a verify_pipeline.sh that compares a real delivered S3 key against the projection template, confirms the subscription is ACTIVE with no delivery error, and runs a query that must return rows.

instance_tag means the version 11 tag fields are populating.Step 4 — Attribute NAT spend to a team
NAT gateway charges $0.045 per GB processed, and those charges arrive in Cost Explorer attached to the NAT gateway — not to the instance, service, or team whose traffic caused them. There is no tag on the charge that says who did it.
SELECT
    url_decode(instance_tag)  AS owning_team,
    instance_id,
    SUM(bytes)                AS bytes_via_nat,
    ROUND(SUM(bytes) / 1073741824.0 * 0.045, 6) AS estimated_nat_usd
FROM flow_logs
WHERE concat(year,'-',month,'-',day) >= date_format(current_date - interval '1' day, '%Y-%m-%d')
  AND flow_direction = 'egress'
  AND next_hop_interface_type = 'nat_gateway'   -- the whole trick
GROUP BY 1, 2
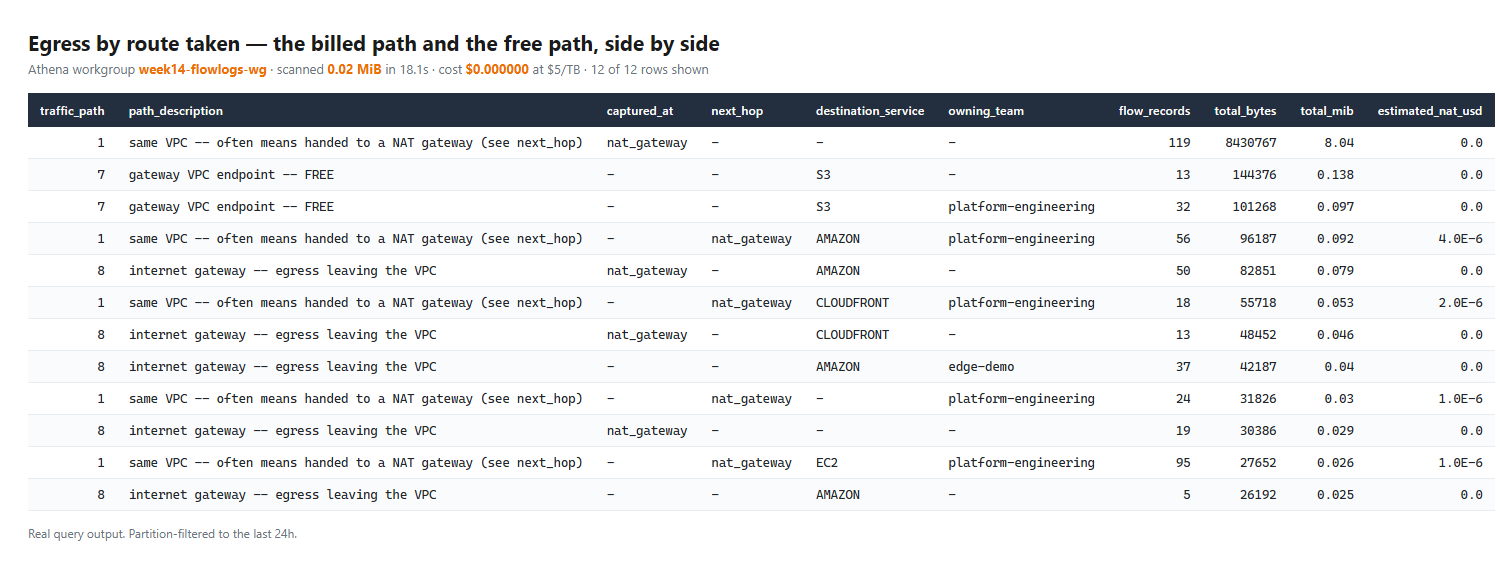
Scaled up: a team quietly pulling 2 TB a month through a NAT gateway for something an S3 gateway endpoint would carry for free is $90 a month that Cost Explorer cannot attribute to them.
Step 5 — Detect scanning without a SIEM
Within twenty minutes of getting a public IP, the exposed instance had been probed by 200 distinct source addresses — ordinary internet background scanning, no provocation needed.
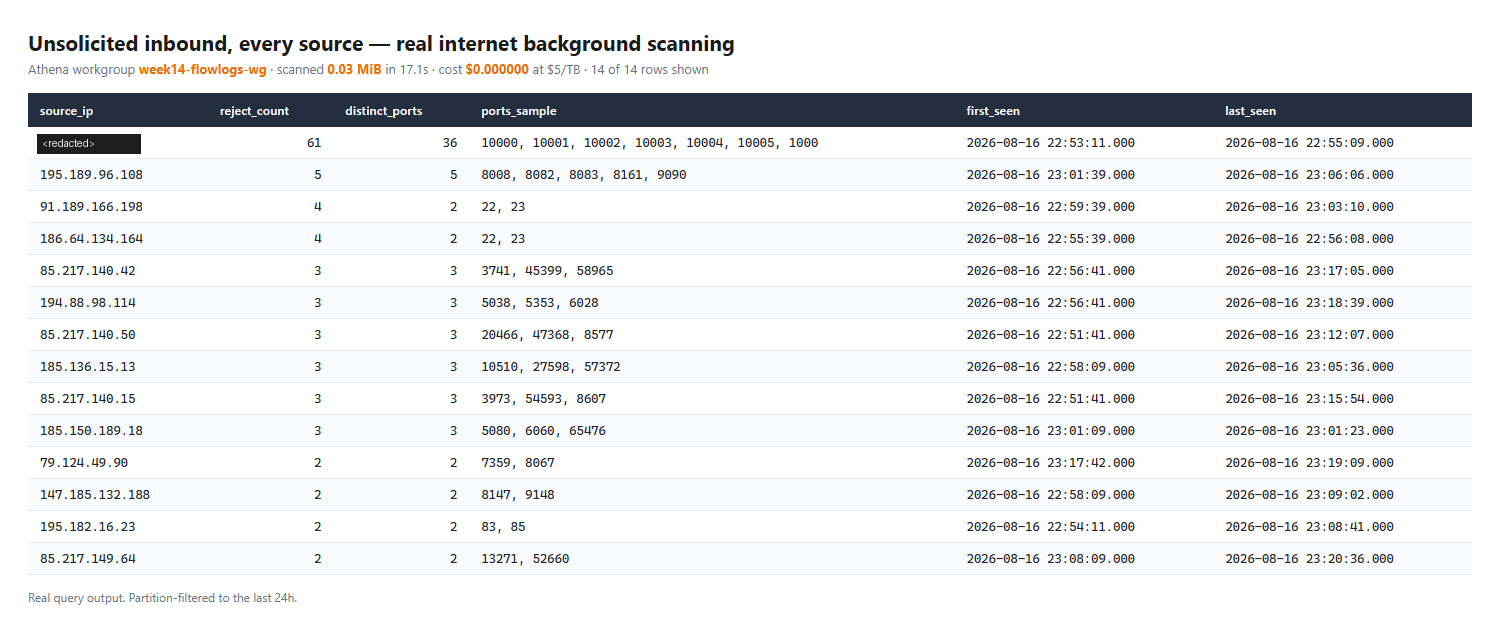
The discriminator between a scan and a broken client is fan-out, not volume — a stuck client retries one port forever, a scanner walks the range. And a rejected connection is not evidence of an attack; it is equally often a health check pointed at a port that moved.
Step 6 — Turn queries into alarms
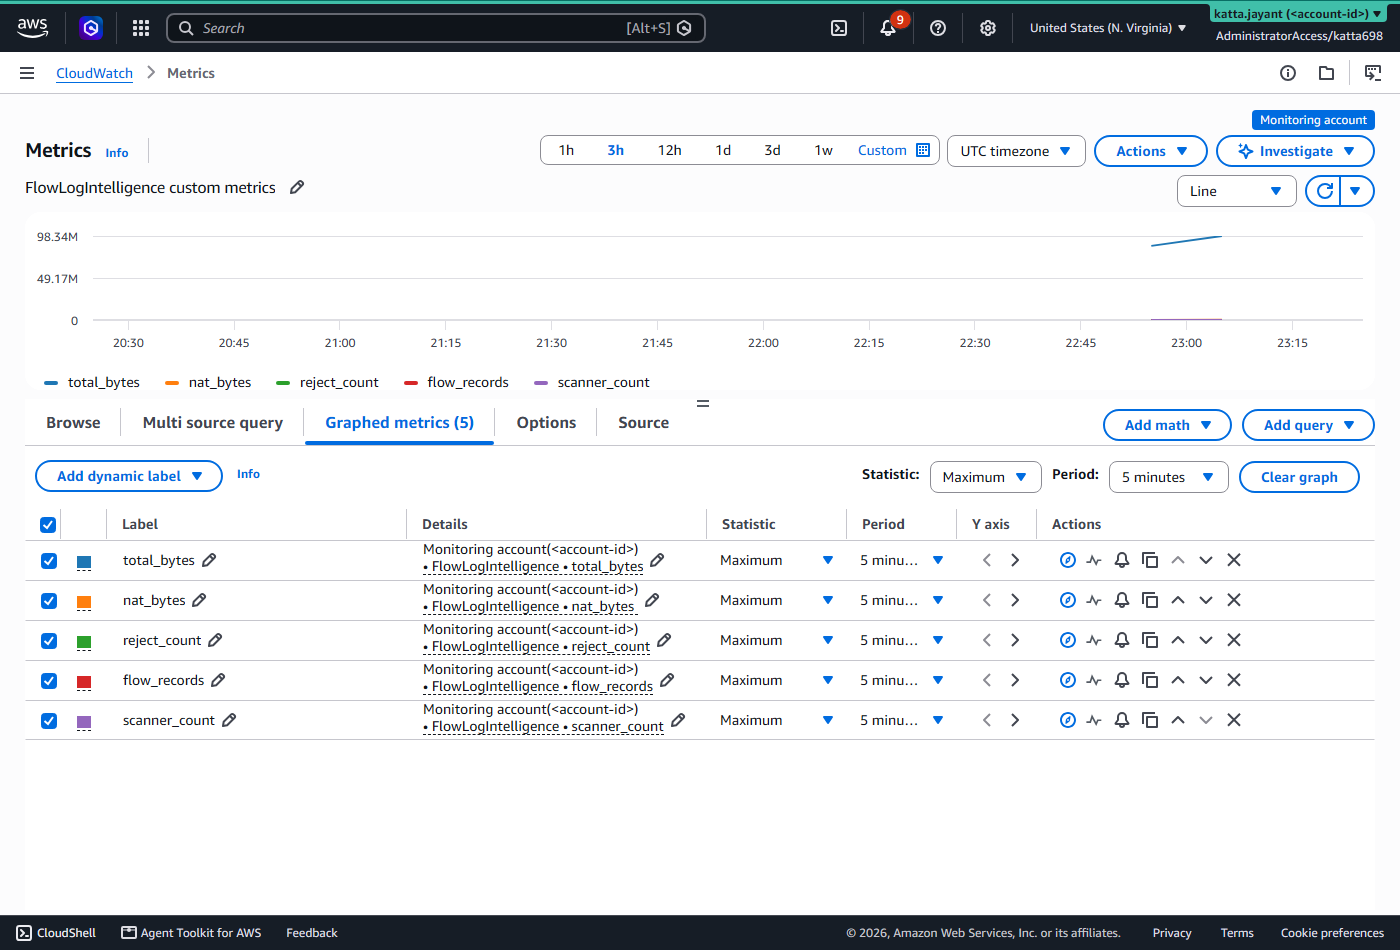
An hourly Lambda runs a handful of aggregate queries and publishes the results as CloudWatch custom metrics.
Anomaly detection band
Traffic volume, NAT egress. Nobody knows a VPC's normal byte volume at deploy time, and it varies by hour of day. A static threshold is either a guess that alarms constantly or a guess that never fires.
Static threshold
Port scans, DLQ depth, analyzer silence. These have a correct value that is a fact rather than a pattern: zero. Anomaly detection would learn a comfortable baseline rate of port scanning and stop reporting it.
Two alarms exist purely to catch the monitoring itself failing: a dead letter queue with a depth alarm, because otherwise a broken analyzer and a quiet network are indistinguishable; and an invocation alarm with treat_missing_data = "breaching", because a missing datapoint is the failure when the question is "did this run at all".
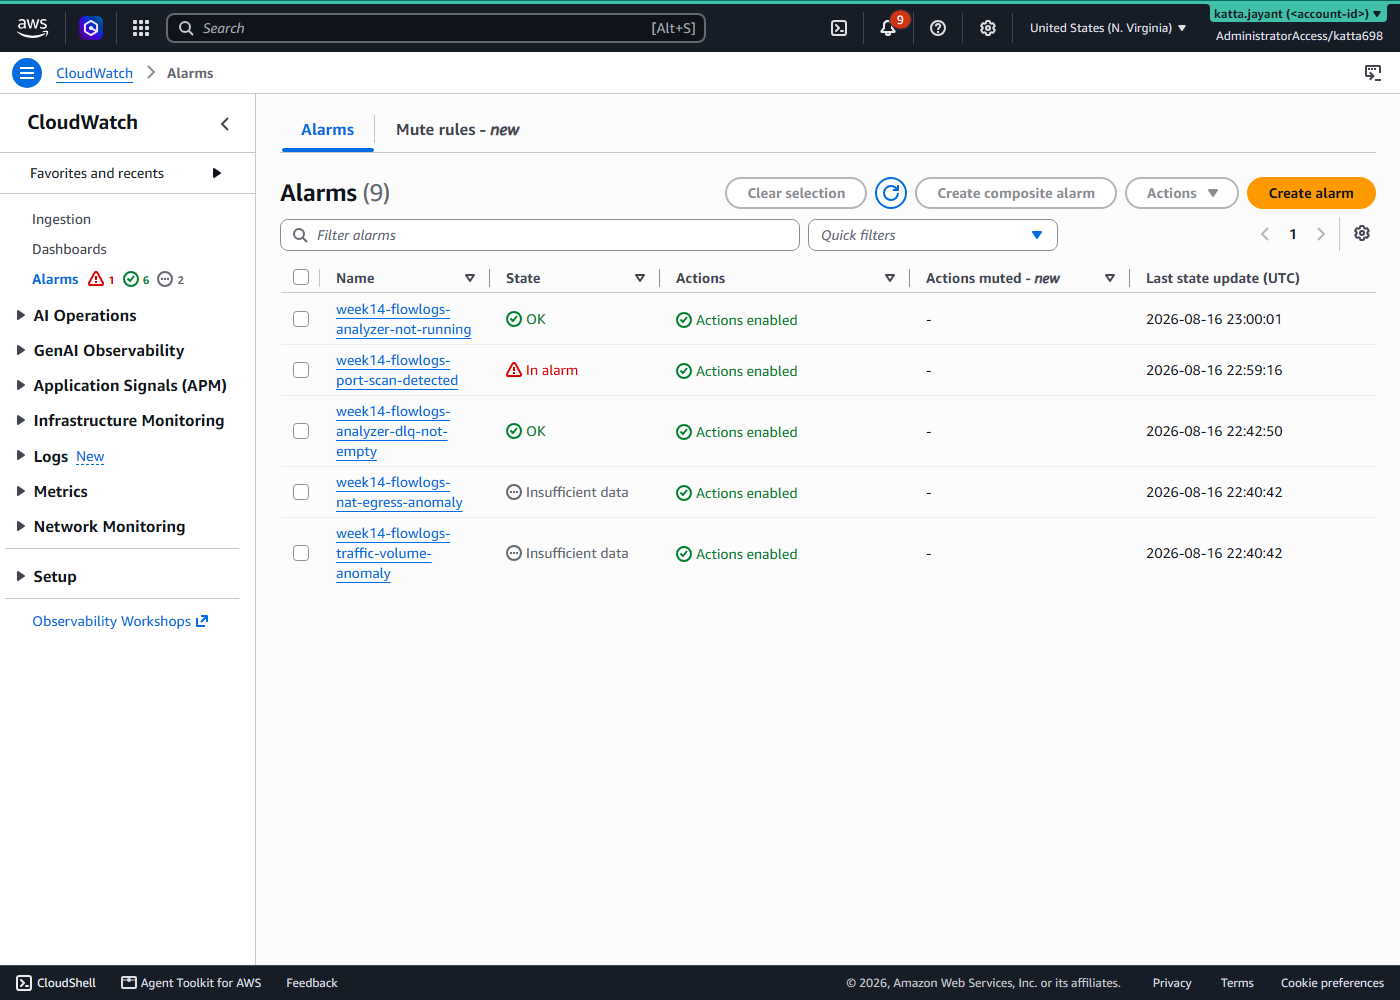
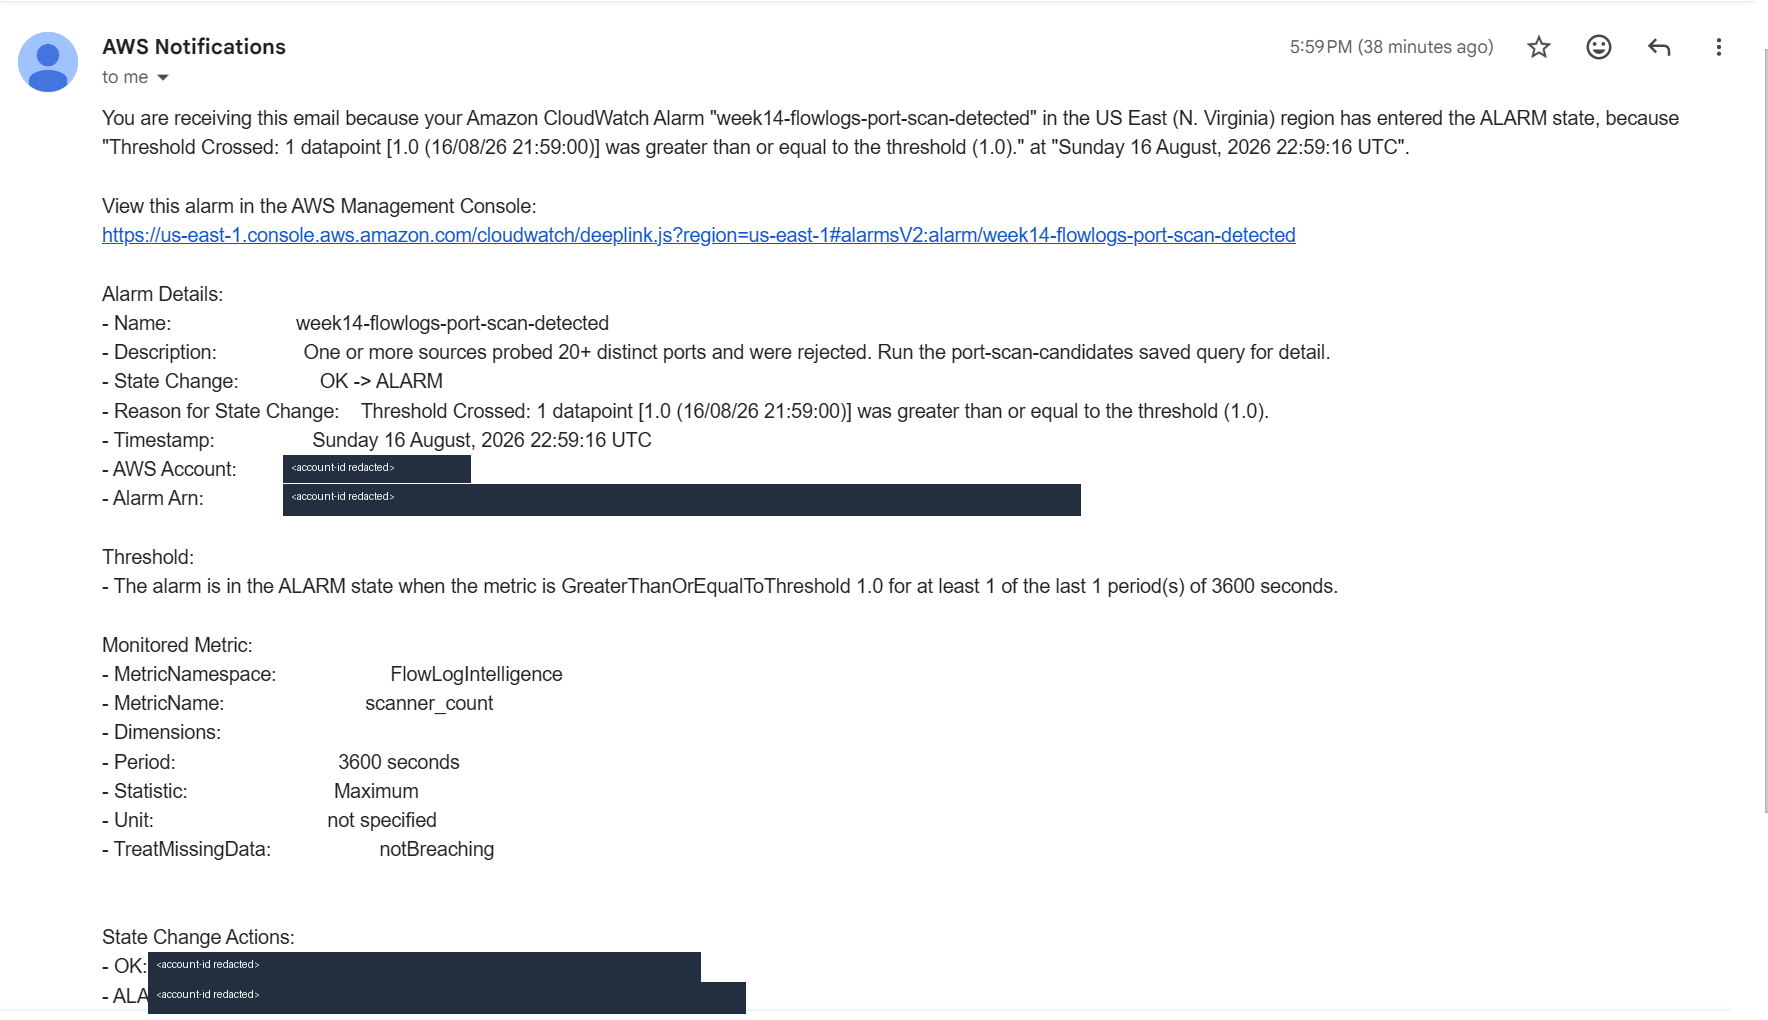
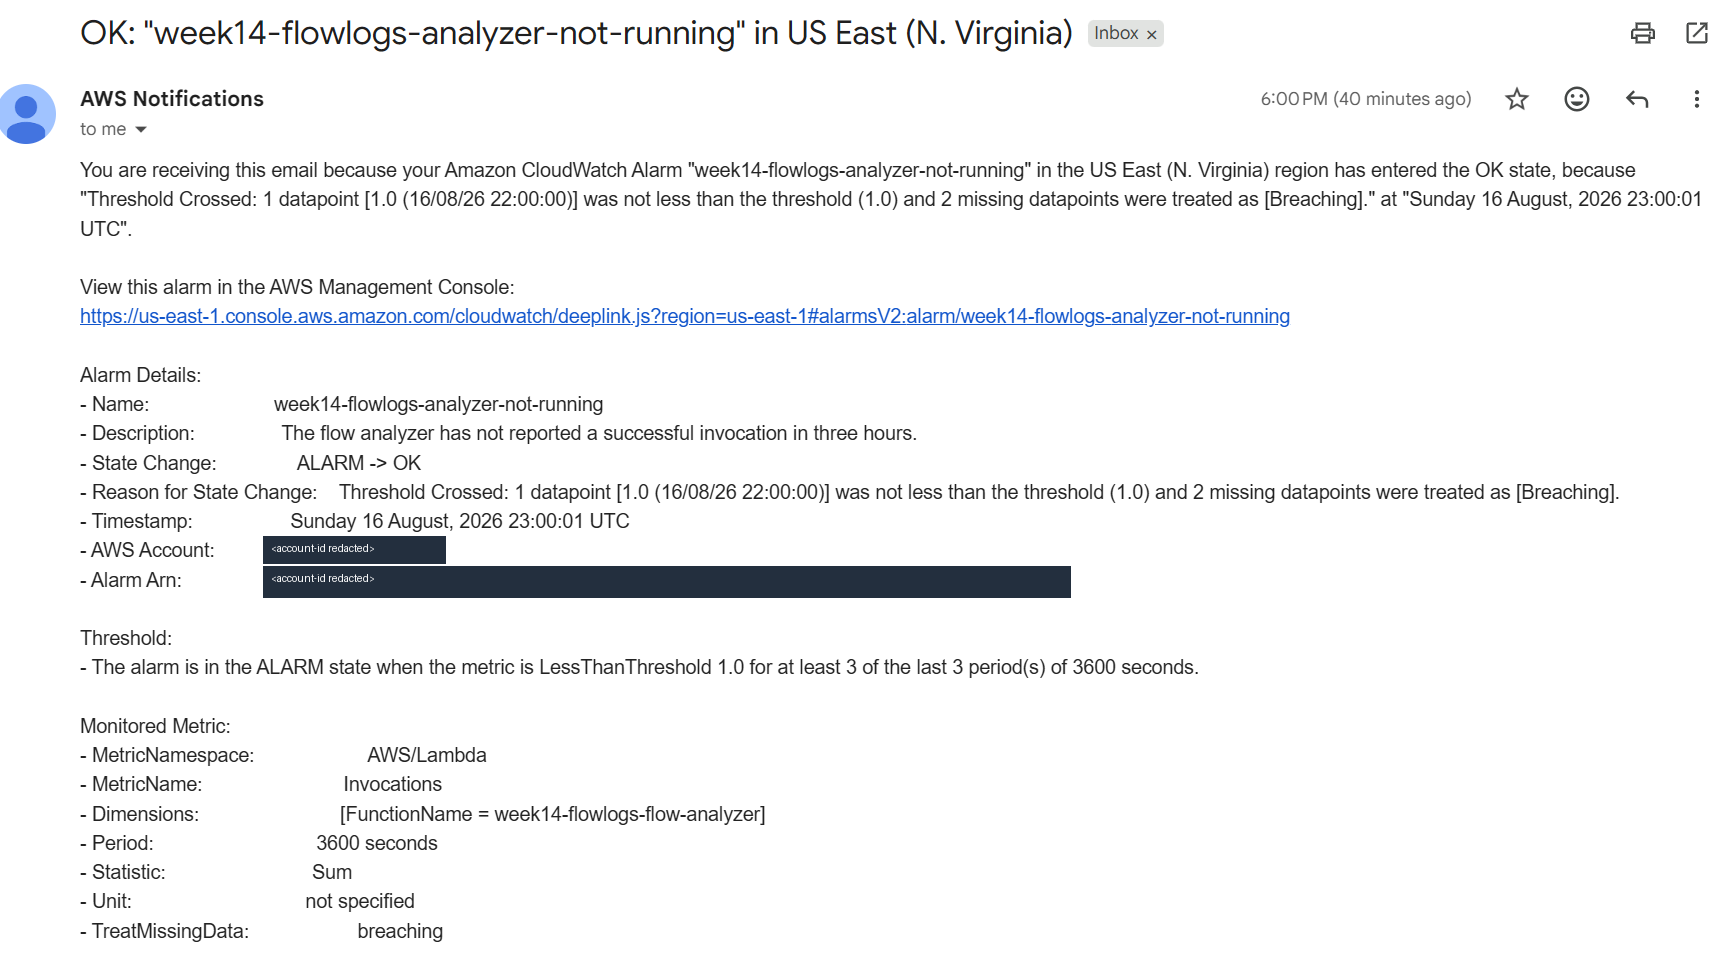
analyzer-not-running uses treat_missing_data = "breaching", so it correctly alarmed while nothing had run yet — then cleared eighteen minutes later when the analyzer reported in.Step 7 — Cap the query spend
Athena bills $5 per TB scanned with no built-in spend limit, so the workgroup carries a hard per-query ceiling, enforced at workgroup level where no client can opt out of it.
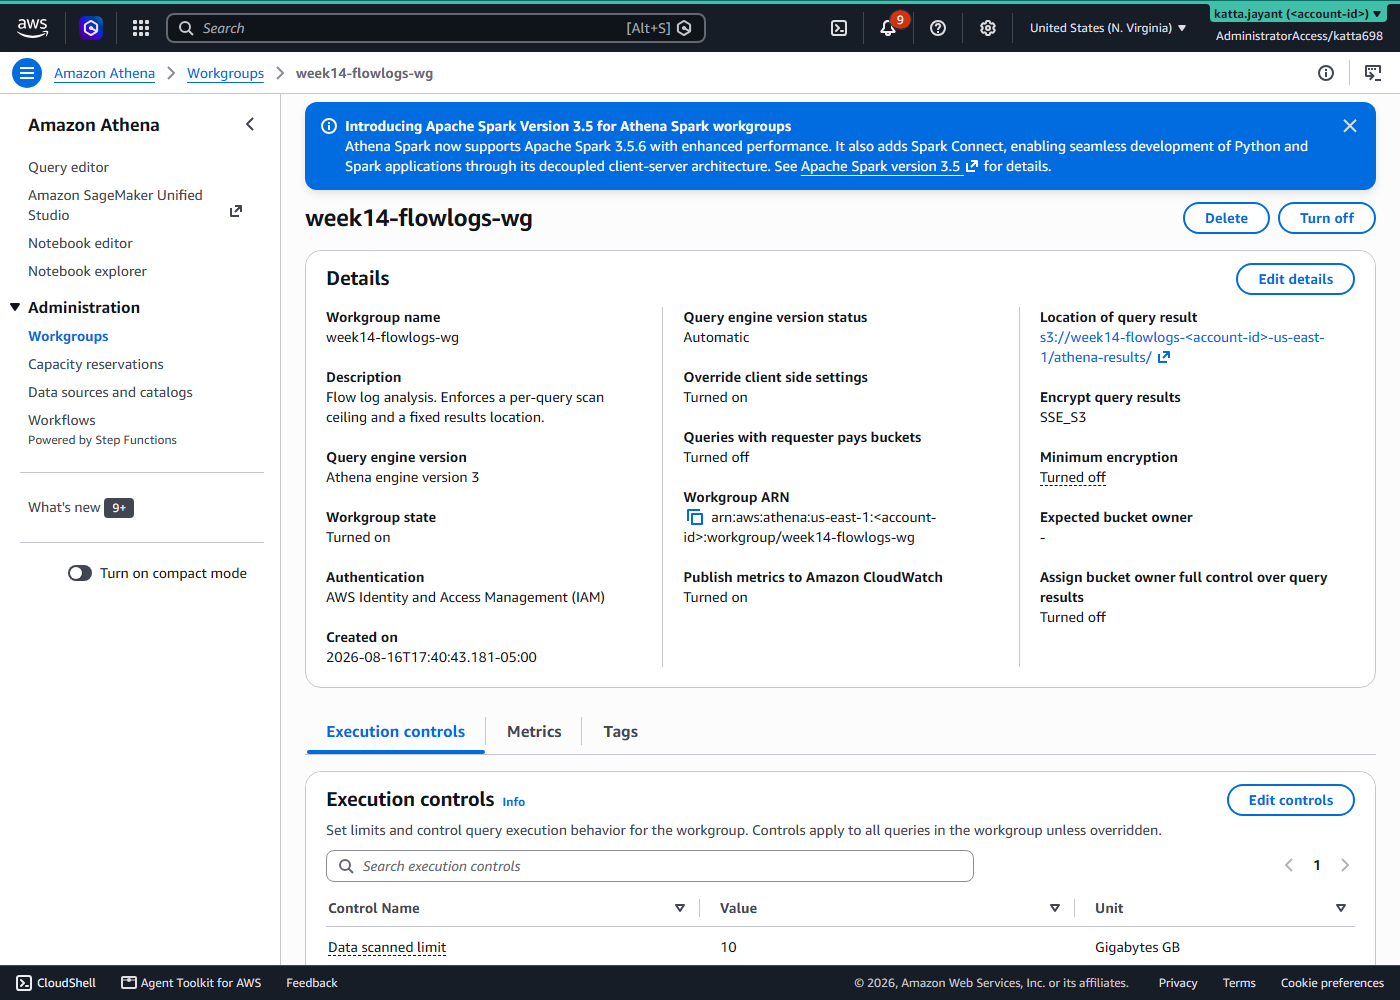
Every saved query filters on partitions, and the numbers in the screenshots above show why it matters: the real queries in this post scanned 0.01–0.03 MiB each.
Challenges — What Actually Went Wrong
One wrong availability zone, wearing three disguises
The first apply failed with three unrelated-looking errors at once: NatGateway NotAvailableInZone, gp3 VolumeTypeNotAvailableInZone, and t4g.nano not offered.
One cause. data.aws_availability_zones with state = "available" also returns opted-in Local Zones. This account has the Dallas Local Zone enabled, so names[0] resolved to us-east-1-dfw-1a, and Local Zones carry a deliberately reduced subset of regional services.
The fix filters on zone type and intersects with the instance type's actual offering list. Worth keeping the second half even with the filter: among genuine AZs, us-east-1e offers neither Graviton nor gp3.
traffic_path cannot attribute NAT cost
The NAT attribution query returned zero rows and the analyzer published a permanent nat_bytes = 0. Both looked like a broken pipeline. Neither was.
traffic_path is relative to the capture point, not the journey. Measured at the sending instance's own ENI, traffic heading to a NAT gateway records traffic_path = 1 — "another resource in the same VPC" — because from that ENI, that is literally what the next hop is. The NAT gateway's own ENI separately records traffic_path = 8 for the same bytes, but a NAT gateway is not an instance and carries no tag. And traffic_path = 2, the documented "internet or NAT gateway" value, never appeared in real data at all.
The v11 field next_hop_interface_type is what actually solves it, putting the instance's tag and the NAT destination on the same record.
An S3-destination flow log cannot take a delivery role
InvalidParameter: DeliverLogsPermissionArn is not applicable for s3 delivery. A delivery role applies only to the CloudWatch Logs destination; for S3 the permissions come from the bucket policy.
The role was there to grant ec2:DescribeTags for the v11 tag fields, which was the wrong mechanism entirely. Calling CreateFlowLogs with TagFieldSpecifications makes VPC Flow Logs create the service-linked role AWSServiceRoleForVPCFlowLogs automatically, and that role carries the tag-reading permissions. The only grant that matters is iam:CreateServiceLinkedRole on whatever runs Terraform.
Tag values arrive percent-encoded
platform-engineering is delivered as platform%2Dengineering. The field documentation does say special characters are percent-encoded, but it is easy to skim past and the symptom is subtle — values look almost right, while any GROUP BY on a tag containing a hyphen, space or slash quietly splits. Every tag column needs url_decode().
Security — Controls at Every Layer
One deliberate exception runs through this build: the exposed instance is internet-reachable on purpose. Its security group has no ingress rules at all, so nothing can connect — and those denials are what generate the REJECT records the detection queries analyse. It holds no data and was destroyed with the rest of the stack.
- No SSH, no key pairs, no inbound ports. Instance access is SSM Session Manager only.
- IMDSv2 required on both instances, and encrypted root volumes.
- Bucket hardening: all public access blocked,
BucketOwnerEnforcedownership, SSE-S3 with bucket keys, and a bucket policy that denies any non-TLS request. - Confused-deputy protection: the log delivery statement is scoped by both
aws:SourceAccountandaws:SourceArn, so another account cannot point its flow logs at this bucket. - Least-privilege IAM. The analyzer's Athena permissions are scoped to the single workgroup that carries the scan ceiling — a broad
athena:*would let it run queries outside the guardrail the whole design depends on.PutMetricDatasupports no resource-level permission, so it is constrained by a namespace condition instead. - Spend treated as a security control. The 10 GB per-query ceiling is enforced at workgroup level, so a shared workgroup cannot be turned into an unbounded bill by someone who has not read the docs.
Cost
Prices as of August 2026 — verify at aws.amazon.com/vpc/pricing and aws.amazon.com/cloudwatch/pricing before quoting them.
| Item | Rate | 48-hour build |
|---|---|---|
| NAT Gateway | $0.045/hr + $0.045/GB | ~$2.16 |
| 2 × t4g.nano | $0.0042/hr each | ~$0.40 |
| Flow log ingest to S3 | $0.25/GB | < $0.10 |
| Athena | $5/TB scanned | cents |
| Anomaly alarms × 2 | $0.30/month each, prorated hourly | ~$0.02 |
| Total | ~$3 | |
| Destroyed | $0 |
Left running: about $33 a month, roughly three quarters of it NAT gateway. The NAT bills whether or not a single packet flows and produces no usage signal to remind you it exists. On this build, forgetting is the risk — not the rate.
The cost controls are in the code rather than in advice: a 30-day expiry on raw logs, a noncurrent-version expiry alongside it (versioning is on, so expiry alone would only create delete markers while the billed bytes stayed), a multipart-upload abort for orphaned partial writes that are invisible in the console listing and billed anyway, and the Athena scan ceiling.
Cleanup
The workspace is VCS-connected, which blocks terraform destroy from a CLI checkout but not a destroy queued through HCP — either from the UI (Workspace → Settings → Destruction and Deletion → Queue destroy plan) or the API with is-destroy: true.
./scripts/cleanup.shThe script does not destroy anything; it verifies a destroy actually finished and reports what survived. It distinguishes three outcomes rather than two — gone, still present, and could not verify — because an expired session returning an empty result otherwise reads as a clean teardown while having checked nothing at all.
What tends to linger on this build, and why:
- The NAT gateway — the expensive one, with no usage signal to remind you it exists.
- The Elastic IP — billed hourly once detached, and it outlives the NAT gateway it belonged to.
- Anomaly detectors — a separate API from alarms, so they survive alarm deletion and quietly confuse a later rebuild with a stale trained band.
One thing that is not leftover state: AWSServiceRoleForVPCFlowLogs survives the destroy by design. AWS wants all tag-using subscriptions gone and roughly an hour to pass before it can be removed.
References
- Week 14 source on GitHub — Terraform modules, the seven saved queries, analyzer Lambda, verification script
- VPC Flow Logs record fields — the version table, including the v11 tag and next-hop fields
- Flow log file layout in S3 — the Hive-compatible and hourly prefix structures
- Service-linked roles for VPC Flow Logs — what
AWSServiceRoleForVPCFlowLogsdoes, and why no delivery role is needed - Athena partition projection · Parquet flow log example
- Terraform
aws_flow_log—destination_optionsandtag_field_specification - Amazon VPC pricing · CloudWatch pricing · Athena pricing
Key Takeaways
- Pick S3, not CloudWatch Logs, unless you specifically need metric filters on individual flows. Half the ingest cost, and the only path to Parquet.
- Verify against delivered data, not against your config. Every failure mode here is silent — zero rows and a green "succeeded" look identical to a working system.
- Do not filter on
traffic_pathto find NAT cost. Usenext_hop_interface_type. The field that looks right is measuring something else. - Put a scan ceiling on the workgroup before anyone else touches it. Athena has no default spend limit.
- Mix your alarm types on purpose. Anomaly detection where normal is genuinely unknown; static thresholds where zero is the right answer. Using anomaly detection everywhere costs 30× more and detects less.
- Check which AZ you landed in.
data.aws_availability_zonesreturns Local Zones too, and one wrong AZ can look like three unrelated failures.
What I'd do differently in production
- Send flow logs from every VPC to one account, not one bucket per VPC. This build is single-VPC because it is a lab. At organisation scale the value is cross-account, and the table definition is the same either way.
- Raise the aggregation interval, or accept the bill. A 1-minute interval gives tighter incident timelines and produces far more billable GB. At real traffic volumes that trade-off deserves a deliberate decision rather than a default.
- Convert to a partitioned summary table. Querying raw records is fine at lab volume. At terabytes, a nightly rollup of the handful of aggregates the alarms need would cost less than scanning raw Parquet every hour.
- Give the anomaly bands weeks, not hours. Both detectors here sat at
INSUFFICIENT_DATAfor the life of the build, which is honest but not useful — a band needs real diurnal history before it means anything. - Alarm on the cost metric, not just the traffic metric. The analyzer already publishes a projected monthly NAT figure; in production that is the number a platform team actually wants paging them, not raw bytes.
Comments